Power BI Tutorial | A Series – Part 2: Setting Up Your Workspace for Data Success
Welcome to Part 2 of our Power BI Tutorial Series! Setting up your Power BI is important before beginning to develop dashboards and data storytelling. Think of this as laying the foundation before you build the house.
Whether you’re a beginner just getting started or a business onboarding analysts across departments, this guided blog will walk you step by step through the setup process, from downloading Power BI Desktop to connecting your first dataset.
Let’s set up Power BI and begin our storytelling journey with WeCloudData- The leading data and AI training academy.
Getting Started with Power BI: Tools & Setup Requirements
Before officially starting our environment setup, let’s make sure you’ve got everything in place:
- A Windows computer (Power BI Desktop is not available for Mac)
- A stable internet connection
- A work or personal email address
- 10–15 minutes of setup time
Step 1: Create a Free Power BI Account
While Power BI Desktop is free and doesn’t require an account, businesses need a Power BI Service account (Power BI on the cloud) in order to publish reports, collaborate, and share dashboards.
Steps to create a Power BI Service account
- Go to https://app.powerbi.com
- Click “Sign up for free.”
- Enter your work or school email.
- Verify your email and follow the prompts
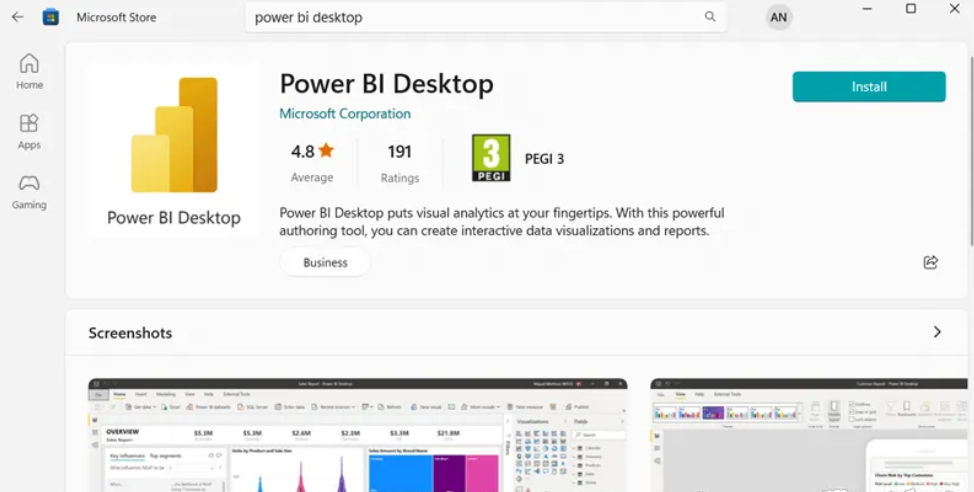
Step 2: Download and Install Power BI Desktop
The Power BI Desktop app is where most of the development happens, like creating visuals, writing DAX formulas, and shaping data.
Download Options:
- From the Microsoft Store
- Or via the official Power BI download center
Tips for Installation:
- Windows 10/11 is compatible.
- No administrator privileges are required for the Microsoft Store installation.
- Make sure you provide a monthly update. Microsoft frequently releases performance and feature upgrades.
To get the step-by-step process of Power BI installation, follow the official documentation here.
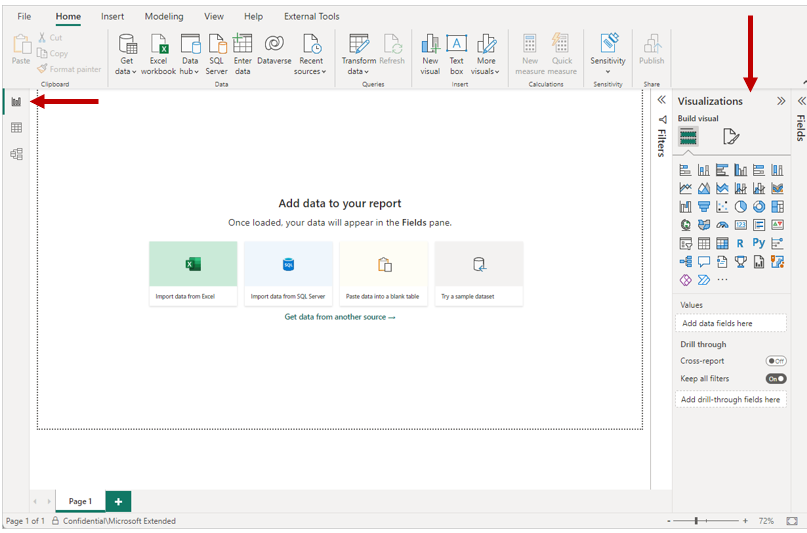
Step 3: Get Familiar with the Power BI Interface
Once installed, launch Power BI Desktop. You’ll be greeted with the Welcome screen, which includes options like:
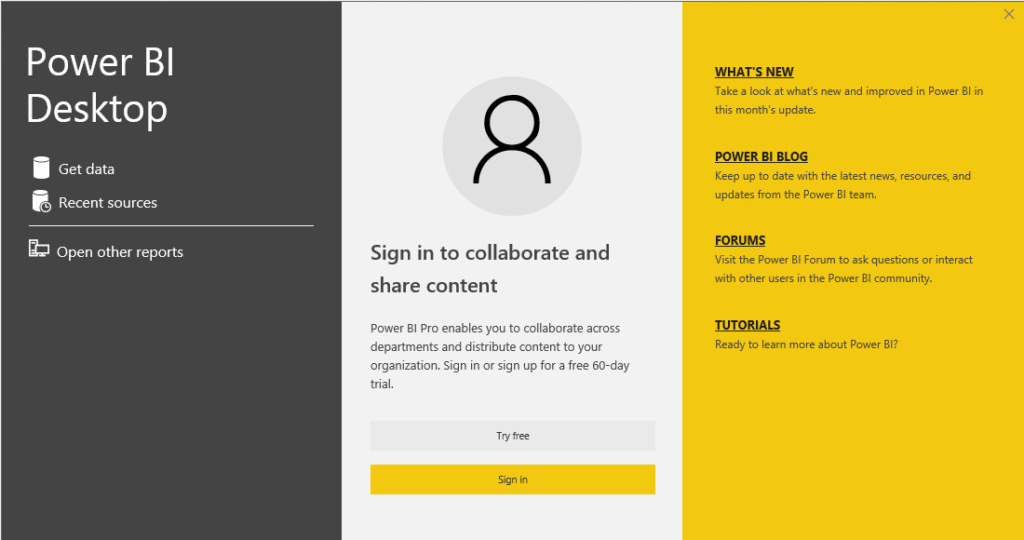
Tip: You can use Power BI Desktop without signing in. However, you will need to sign in when you’re ready to publish your report to the Power BI Service.
Sign In:
- Click on the “Sign In” button.
- Enter your work or school email address.
- Follow the prompts to complete the login process.
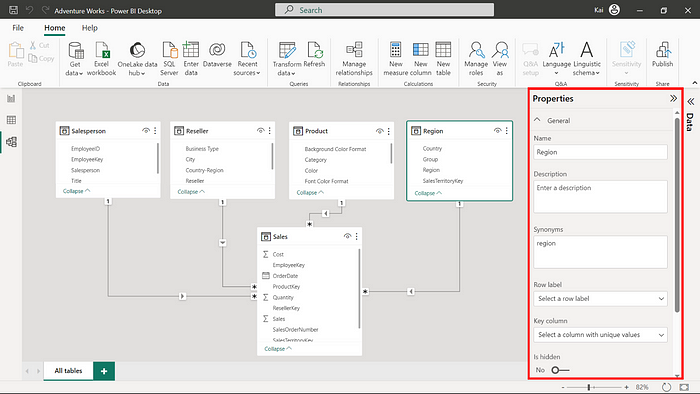
Power BI Main Components
Power BI Desktop consists of Power BI Views, referred to as main components. Power BI Views have three types that help users create detailed and interactive reports.
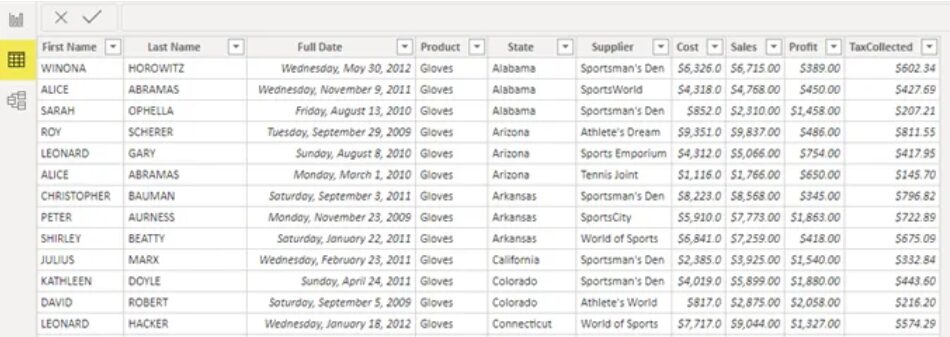
2. Data View: See your raw data in table format and check calculations
3. Model View: Manage relationships between tables and build a data model
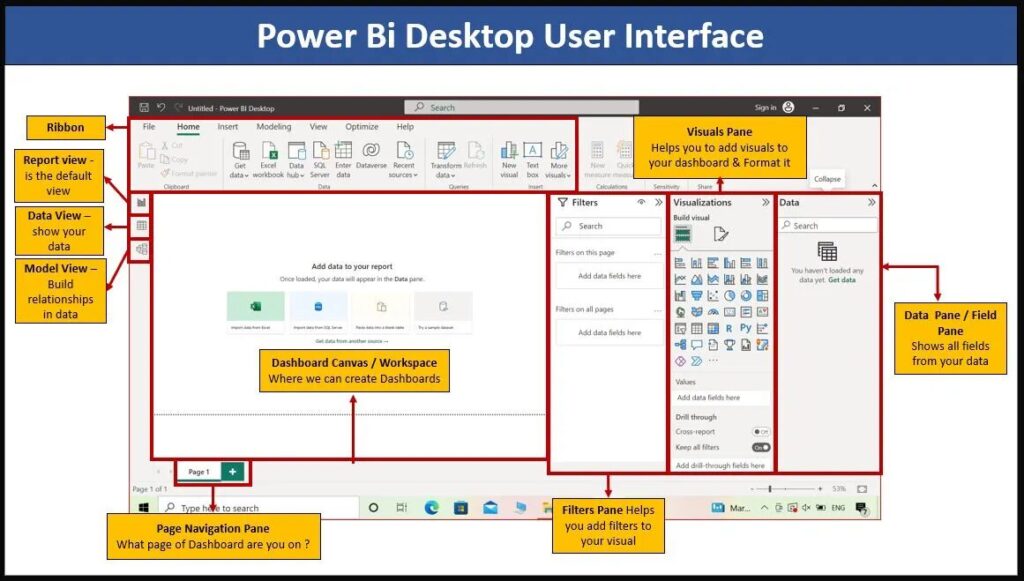
Key Interface Elements
Take time to click around, Power BI’s interface is user-friendly and intuitive.
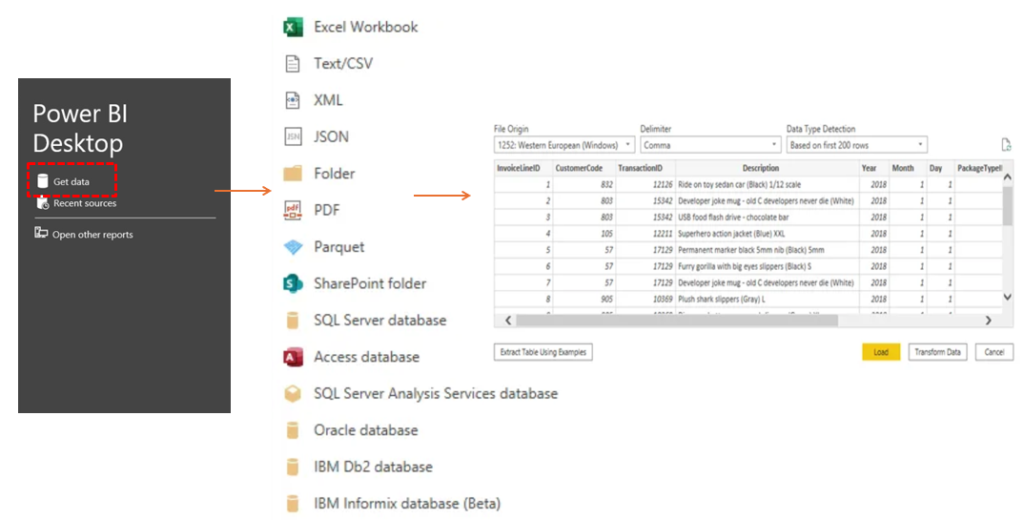
Step 4: Connect to Your First Dataset
Let’s load data into Power BI so you can start experimenting.
Try this simple exercise:
- Click Get Data → Choose Excel or CSV
- Load a basic dataset, like sales, customers, or products.
- Choose the relevant sheets or tables and click Load.
Step 5: Preview Power Query Editor
Click Transform Data to launch Power Query, which is a built-in tool in Power BI for pre-analysis data cleansing and structuring.
Here, you can:
- Change the columns’ names.
- Modify the types of data.
- Delete any blank rows.
- Split columns (e.g., full name into first/last)
- Add or combine datasets.
You don’t need to be a coder to use Power Query; it’s mostly point and click.
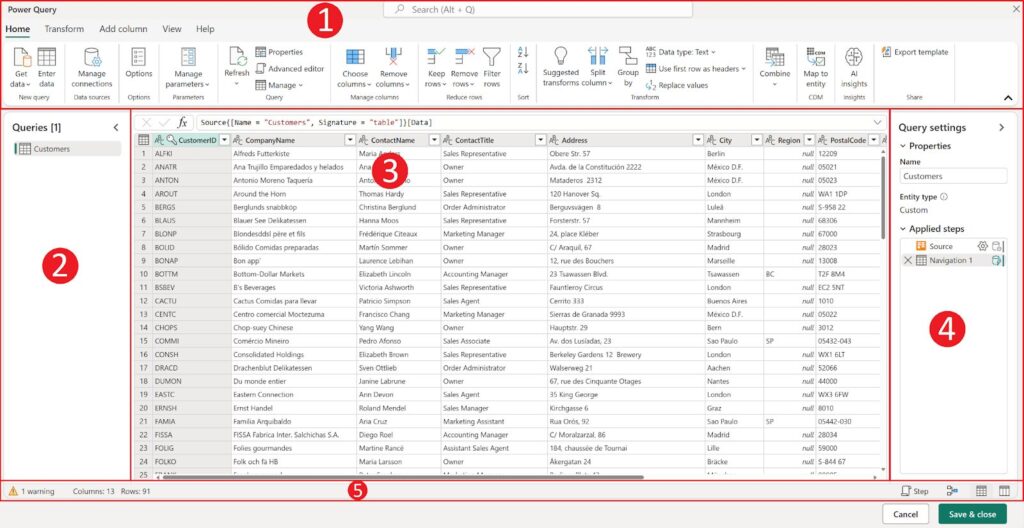
Power Query Editor: Key Interface Elements Explained
When you open Power Query, you’ll see a few important panels and tools that help you clean and shape your data:
- Ribbon: Located at the top, the ribbon organizes various tools into tabs. Ribbon is used to apply data transformations, manage queries, and perform actions like grouping rows or changing column types.
- Queries Pane: This side panel shows all the data sources you’ve loaded. The Queries pane is used to switch between them to edit or review each query individually.
- Main View (Data Preview): The main view is the central workspace where you can preview your data as it will appear after transformations. Main view allows toggling between different layouts, including a diagram-style view for understanding table relationships.
- Query Settings Panel: On the right, this section displays details about the selected query, such as its name and a step-by-step list of applied transformations.
- Status Bar: Found at the bottom, the status bar gives you useful info like how many rows and columns are currently loaded, processing status, and buttons to change how your data is viewed.
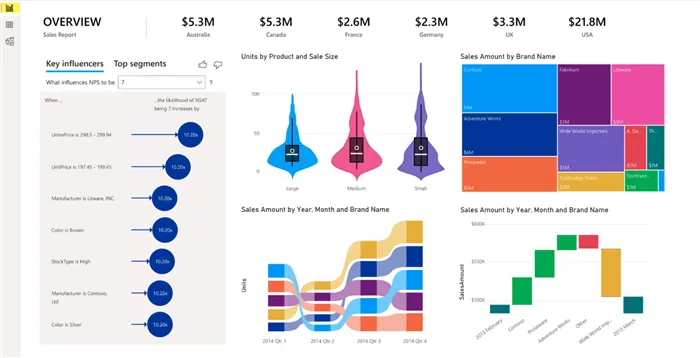
Step 6: Create a Simple Visualization
Now that we’ve loaded and transformed data using Power Query, it’s time to move into the Report View, where you’ll start turning raw data into meaningful visuals and explore Power BI data visualization.
Power BI’s drag-and-drop interface makes data visualization exceedingly simple. Even if you’ve never created a report before, you’ll be able to build your first Power BI data visualization in just a few clicks.
Let’s Build Your First Chart:
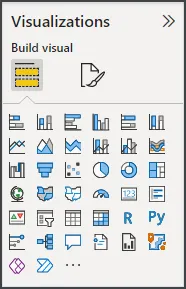
- Go to the Report View (by default, this is already open).
- In the Visualizations pane, click on the bar chart icon.
- A blank visual appears on the canvas.
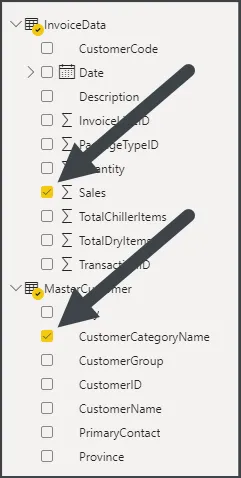
- In the Fields pane:
- Drag a categorical field (e.g., CustomerCategoryName ) into the Axis section of the chart.
- Drag a numeric field (e.g., Sales) into the Values section for your power bi data visualization.
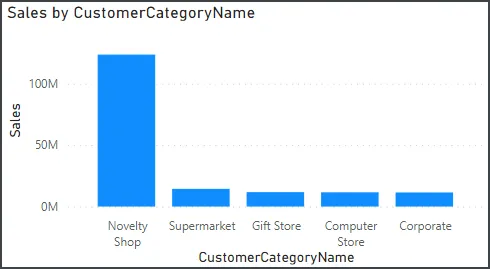
And just like that, you’ve created your first power bi data visualization, bar chart!
Explore More Visual Elements
To make the report more interactive and insightful, more visualization options are there to choose from Power BI Data Visualization panel.
- Slicer: Add a slicer for a field like Region or Year so users can filter the chart by location or time.
- Card Visual: Use the Card visualization to display a single key metric like Total Sales or Total Orders at a glance.
- Filters Pane: Apply a filter to show only data from the last 12 months or specific product lines for focused analysis.
Power BI Course Training with WeCloudData
Want to go from beginner to job-ready or project-ready? WeCloudData offers one of the best Power BI training programs for both individuals and corporate teams.
WeCloudData’s Program Includes:
- Live instructor-led training (not pre-recorded)
- Hands-on projects using real data
- Power BI Desktop tutorial walkthroughs
- Downloadable Power BI tutorial PDF and reusable templates
- Final capstone portfolio for job search
Whether you’re a team upskilling your analysts or an individual planning a Power BI developer career path, our curriculum adapts to real-world expectations.
Why WeCloudData Is Your Data Partner
Here’s how WeCloudData supports future data leaders and forward-thinking organizations:
- Top-Rated Training Programs in Descriptive Analytics, BI, Python, and SQL
- Real-World Project Experience using enterprise BI tools and actual business cases
- Enterprise Consulting Services to help teams build dashboards, automate reporting, and scale data-driven decision-making
- Talent Solutions that connect companies with skilled, job-ready graduates trained in tools like Power BI
Whether you’re launching a data career or building internal BI capabilities, WeCloudData is the trusted partner to help you succeed.
👉 Ready to build your team’s data skills or start your analytics journey?
Visit weclouddata.com to explore our programs, consulting services, and talent solutions.
What’s Next in This Power BI Tutorial Series?
It’s time to establish a solid analytical foundation with data preparation and modeling now that you know how to set up your environment, connect a data source, and produce your first Power BI data visualization.
Before you start creating more complex reports and dashboards, this is an essential next step.
Coming Up Next:
Part 3: Power BI Data Preparation & Modeling — Clean and Shape Your Data Like a Pro
In the next blog post of the Power BI Tutorial Series, we’ll guide you through:
- Exploring the Power Query Editor interface
- Cleaning and shaping raw data for analysis
- Performing column transformations and setting the correct data types
- Building a simple data model and managing relationships
- An introduction to DAX, Power BI’s formula language
- Writing simple DAX functions to power your metrics
Happy learning and stay tuned!
