
Getting an AI application past the deployment phase is a major milestone, but going live is only the beginning of the system’s operational lifecycle. Traditional software development often operates under the assumption that if an application passes health checks, stays online, and returns standard success status codes, the system is healthy.
For AI-driven systems, this assumption quickly breaks down.
An AI application can run perfectly from an infrastructure perspective while quietly failing in ways that hurt your business. A Large Language Model (LLM) endpoint might respond within acceptable timeframes while serving hallucinations, returning biased outputs, or delivering irrelevant information. A predictive model might experience silent accuracy degradation because incoming user data has shifted—a phenomenon standard server metrics will never catch.
To maintain system integrity, AI, ML, and DevOps teams need multi-layered visibility across infrastructure, data pipelines, model behavior, and generated outputs. This comprehensive field of continuous oversight and troubleshooting is known as AI Observability.
What Is AI Observability?
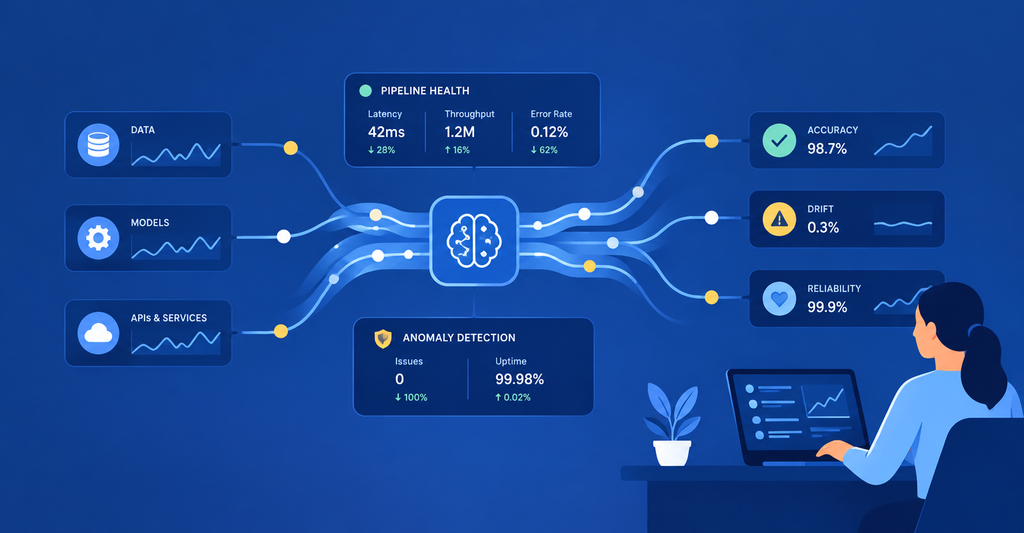
AI observability is the practice of capturing operational data, performance scores, and system logs to understand, measure, and troubleshoot the internal behavior of an AI system in production.
While traditional software monitoring tracks the health of the underlying infrastructure, AI observability goes several steps deeper. It combines foundational system data—such as logs, metrics, and event traces—with domain-specific evaluations that examine model predictions, document retrieval accuracy, and system outputs.
By maintaining unified visibility across every tier of the stack—from raw data pipelines and third-party APIs to cloud infrastructure and model weights—AI observability provides engineers with the tools to understand why a system is behaving in an unexpected way, supporting continuous troubleshooting, performance tuning, and long-term reliability.
Why Traditional Monitoring Isn’t Enough for AI
Standard Application Performance Monitoring (APM) tools are built to measure system determinism. They answer simple questions: Is the service up? Is the API timing out? Is CPU utilization spiking?
AI applications, however, are fundamentally probabilistic. Their behavior changes based on input distributions, shifting real-world conditions, and the complex nature of language and predictive models.
| Metric Type | Traditional APM Capabilities | AI Observability Capabilities |
| System Status | Checks if API endpoints respond successfully | Validates whether the API response is accurate, grounded, and safe |
| Latency | Tracks network delays and server response times | Isolates delays across document search, token generation, and model inference |
| Data Health | Confirms payload schema validity | Identifies distribution shifts, data drift, and input anomalies |
| Cost Tracking | Monitors overall cloud server utilization | Tracks token consumption, cost per prompt, and model routing efficiency |
Real-World Failure Modes in AI Systems
- The Silent Correct Response: A customer service bot returns a successful status code, but the generated answer completely hallucinates a product feature.
- Degraded Model Drift: A credit-scoring model endpoint stays available, but changes in consumer economic behavior degrade prediction accuracy over time.
- Retrieval Failure in RAG: A Retrieval-Augmented Generation (RAG) system executes successfully, but the search database pulls irrelevant documentation chunks, leading to a useless answer.
Relying solely on standard application monitoring creates operational blind spots. Robust AI observability builds on top of conventional application monitoring, extending visibility deep into model outputs and contextual quality.
Key Components of AI Observability
To establish complete visibility into a production AI application, observability must be implemented across five core layers.
1. Infrastructure and Application Performance
At the base level, AI applications require standard performance tracking. Teams must track system availability, response times, memory utilization, API error rates, and underlying network hardware. For self-hosted models, this includes tracking specialized hardware performance like GPU memory allocation and compute usage.
2. Model Performance and Prediction Quality
For classical machine learning systems (like classification or regression models), monitoring requires evaluating task-specific metrics over time. Teams track prediction distributions, classification confidence scores, and real-time accuracy whenever correct baseline labels become available. Sudden shifts in prediction distribution often signal changes in underlying system dynamics.
3. Data Quality and Model Drift
AI models reflect the training data they were built on. When real-world production data diverges from training baseline data, model accuracy degrades.
- Data Drift: Changes in the statistical properties of input features (e.g., shifts in demographic user inputs).
- Concept Drift: Changes in the mathematical relationship between input data and target variables (e.g., changes in consumer purchasing behavior over time).
4. LLM Output Quality and Retrieval Performance
Generative AI and RAG architectures introduce complex output quality evaluations. Instead of simple pass/fail checks, teams monitor:
- Faithfulness & Groundedness: Ensuring the AI output is derived strictly from provided reference materials.
- Answer Relevance: Confirming the output directly addresses the user’s prompt.
- Hallucination Risk: Identifying fabricated facts or invalid statements.
- Retrieval Performance: Measuring how accurately the system pulls relevant source documents from a knowledge base.
Because no single metric captures overall output quality, teams combine automated evaluation frameworks (like using a secondary LLM as a judge) with human-in-the-loop feedback mechanisms.
5. Cost and Resource Utilization
Generative models can consume substantial financial resources if left unmonitored. Observability frameworks must track token consumption (input vs. output tokens), cost per API request, GPU usage, and the trade-off between cost, speed, and output quality across different model sizes.
AI Monitoring vs. AI Observability
Though often used interchangeably, monitoring and observability serve complementary roles within the operational ecosystem.
| Dimension | AI Monitoring | AI Observability |
| Primary Focus | Tracking pre-defined metrics and thresholds | Investigating unknown failure modes and unexpected behavior |
| Operational Goal | Detects when a failure condition occurs | Explains why the system is failing across layers |
| Action Type | Triggers alerts and notification workflows | Supports root-cause analysis and system debugging |
| System Perspective | Discrete metric checking (e.g., latency > 500ms) | Contextual evidence linking (logs + traces + evaluations) |
Observability does not replace traditional monitoring; it builds upon it. While monitoring alerts you that accuracy has dropped below an acceptable threshold, observability provides the contextual data such as data lineage, API traces, and retrieval logs that are needed to fix the underlying cause.
AI Observability Tools and Technologies
Building an observability stack rarely means using a single tool. Modern architectures leverage specialized toolsets across different layers of the infrastructure:
- Infrastructure & Application Monitoring: Standard open-source monitoring tools like Prometheus and Grafana manage system health, server metrics, resource usage, and basic API endpoints.
- Distributed Tracing Standards: OpenTelemetry acts as an industry-standard framework for collecting application traces and metrics across microservices.
- ML Lifecycle & Experimentation: Platforms like MLflow monitor model metrics, track training parameters, and manage model registries across classical machine learning workflows.
- LLM Tracing & Output Evaluation: Dedicated frameworks such as Langfuse, LangSmith, and Arize Phoenix trace multi-step LLM interactions, run evaluation datasets, measure retrieval precision, and log token usage.
Choosing the right toolset depends on your system architecture, deployment model, compliance requirements, and operational budget. A hybrid infrastructure combining open telemetry standards with LLM-specific tracing frameworks usually offers the best balance of flexibility and depth.
Best Practices for Implementing AI Observability
To build reliable and observable AI systems, consider this operational checklist:
- Define Success Metrics Early: Establish quantitative operational and output quality targets before deploying to production.
- Set Baseline Evaluations: Measure system performance on benchmark test suites prior to deployment to establish reference scores.
- Instrument End-to-End Workflows: Add tracing instrumentation across every component—from input processing and database retrieval to model inference and output sanitization.
- Combine Telemetry with Domain Evaluations: Pair standard infrastructure metrics (latency, error rates) with domain-specific AI evaluation metrics (relevance, drift, toxicity).
- Set Actionable Alerts: Configure threshold-based alerts for critical quality drops and system failures, routing notifications to teams with clear ownership.
- Simulate Known Edge Cases: Regularly test alerting systems against simulated failure scenarios, such as data drift, latency spikes, and low-relevance retrieval results.
- Apply Privacy Safeguards: Implement masking for PII, enforce strict data retention policies, and maintain role-based access controls for logs.
- Establish Feedback Loops: Feed edge cases, low-scoring interactions, and human review feedback directly back into continuous testing, evaluation datasets, and retraining pipelines.
Skills Needed to Build Observable AI Systems
Managing production AI applications requires cross-functional expertise spanning several core technical disciplines:
- AI Engineering: Designing modular AI application architectures, writing prompt evaluation pipelines, and integrating LLM execution frameworks.
- Data Engineering: Managing data pipelines, maintaining data lineage, ensuring input quality, and handling high-volume operational data flows.
- Cloud Engineering: Provisioning scalable serverless or containerized compute infrastructure, managing GPU availability, and optimizing resource costs.
- MLOps & LLMOps Engineering: Implementing continuous deployment pipelines, managing model registries, tracking model lineage, and setting up automated tracing toolsets.
- DevOps Engineering: Configuring site reliability metrics, automated alert routing, log aggregations, and resilient system operations.
Mastering these overlapping technical fields enables engineering teams to transition AI projects from simple local prototypes into enterprise-grade production software.
Building AI Engineering Capabilities With WeCloudData
As organizations move AI initiatives from experimentation into production, they need professionals who can build, deploy, monitor, and maintain reliable AI systems. Developing these capabilities requires more than model development—it demands expertise across AI Engineering, data, cloud infrastructure, and operational practices.
At WeCloudData, we help individuals and organizations build practical, industry-relevant skills across the modern data and AI ecosystem through structured learning paths and corporate training programs.
Our learning tracks support key capabilities across the AI lifecycle:
- AI Engineering and LLMOps: Develop the skills to build, integrate, evaluate, and monitor generative AI applications, including retrieval-augmented generation (RAG) systems.
- Data Engineering and Cloud Engineering: Build reliable data pipelines and understand the cloud infrastructure needed to support data-intensive applications and AI workloads.
- MLOps and DevOps Engineering: Apply automation, CI/CD, model lifecycle management, deployment practices, and monitoring workflows to improve the reliability of production AI systems.
Whether you’re an individual looking to advance your technical expertise or an organization preparing teams to implement AI at scale, WeCloudData’s hands-on learning programs help bridge the gap between technical knowledge and practical application.
These skills become especially important after an AI system goes live. Deploying a model is only the first step; engineering teams must also know how to monitor its behavior, evaluate output quality, investigate failures, and manage performance and costs over time. This is where the capabilities developed across AI Engineering, Data Engineering, Cloud Engineering, MLOps, and DevOps come together to support effective AI observability.
AI observability turns those technical capabilities into an ongoing operational practice. By combining infrastructure telemetry, data and model monitoring, output evaluation, distributed tracing, and cost analysis, teams can identify issues earlier, trace them to their source, and make informed improvements. With the right skills and processes in place, organizations are better equipped to maintain reliable, efficient, and production-ready AI systems long after deployment.
Frequently Asked Questions (FAQ)
1. What is AI observability?
AI observability is the practice of tracking, evaluating, and investigating an AI application’s internal behavior using operational metrics, logs, distributed traces, and task-specific quality evaluations across infrastructure, models, and data pipelines.
2. What is the difference between AI monitoring and AI observability?
AI monitoring tracks pre-defined, known operational metrics (e.g., latency spikes, API availability, or simple accuracy thresholds). AI observability provides the context and multi-layer visibility needed to investigate, diagnose, and resolve unknown or complex failures across the entire system stack.
3. Which tools are used for AI observability?
Teams often use a combination of software tools: Prometheus and Grafana for infrastructure monitoring, OpenTelemetry for tracing, MLflow for machine learning lifecycle management, and dedicated platforms like Langfuse, LangSmith, or Arize Phoenix for LLM tracing and quality evaluations.
4. How do you monitor AI models in production?
AI models are monitored by capturing incoming prompt and feature data, comparing input distributions against baseline training data to identify drift, running task-specific quality evaluations (e.g., accuracy), tracing API workflows, and monitoring underlying infrastructure resources like GPUs.
