In today’s data-driven world, understanding customer purchasing behavior plays a crucial role for businesses aiming to enhance sales and customer satisfaction. Market Basket Analysis is a powerful technique that helps in discovering associations between products purchased together, enabling retailers to make informed decisions on product placements, promotions, and recommendations.
Market basket analysis is a great project for aspiring data scientists to show off their skills in data preprocessing, association rule mining, and data visualization. This blog gives a deep insight into how to do market basket analysis using python, providing step-by-step instructions, code examples, and visualizations to equip you with the knowledge and tools to undertake your own MBA projects. Let’s do market basket analysis using python with WeCloudData.
What is Market Basket Analysis?
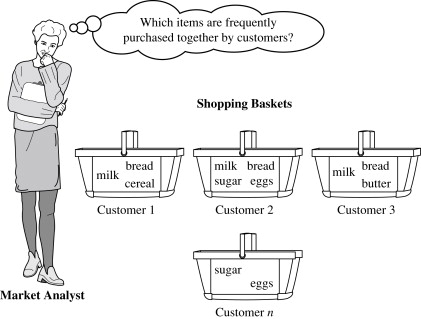
Market Basket Analysis, also known as association rule mining, is a data mining technique that identifies patterns of products’ co-occurrence in transactional data to analyze the purchase behavior of customers. The analysis relies on the concept that customers frequently purchase certain products together, while others are rarely bought in combination. By analyzing these product groupings, businesses can discover customer purchasing habits. They then use the results to boost sales and enhance customer satisfaction.
A very common example is bread and butter, placed near the checkout shelves or bundled in promotions, which can increase sales because data shows that customers frequently purchase them together.
Why Perform Market Basket Analysis?
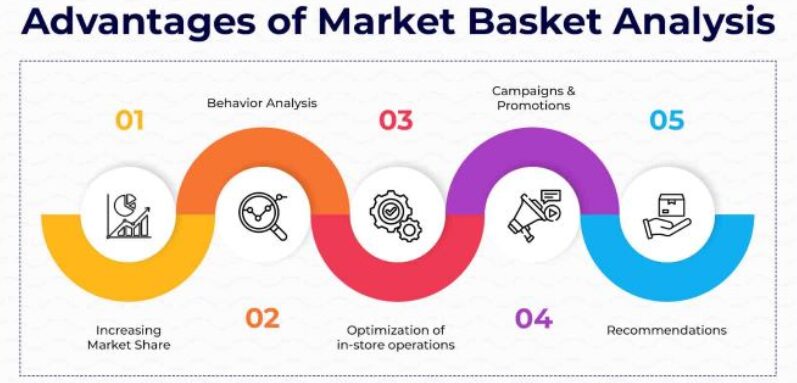
Market basket analysis (MBA) gives multiple benefits, including;
- Product Placement: Optimize store layouts by placing frequently bought items together.
- Inventory Management: Stock items based on purchasing patterns.
- Marketing Strategies: Design targeted promotions and discounts.
- Cross-Selling: Recommend complementary products to customers.
Applications of Market Basket Analysis
Market basket analysis has several applications in different industries. Some of the applications are:
- Retail business: To determine the relationships between various products and how they are bought together, the retail business frequently uses market basket analysis. Retailers optimize their product placement and develop successful cross-selling strategies based on the analysis’s findings.
- E-commerce: To personalize clients’ shopping experiences, e-commerce websites use market basket analysis. Customers are given product recommendations based on their interests and past purchases, predicted by the MBA.
- Banking: To determine the connections between various banking products and how they are used in combination, the banking sector uses market basket analysis. Product placement is optimized, and cross-selling tactics are developed with the help of the analysis.
- Healthcare: Market basket analysis in the healthcare industry can identify the relationship between different diseases and symptoms. The analysis can identify the most effective treatments for specific diseases.
Implementing Market Basket Analysis using Python
Data Collection and Preprocessing
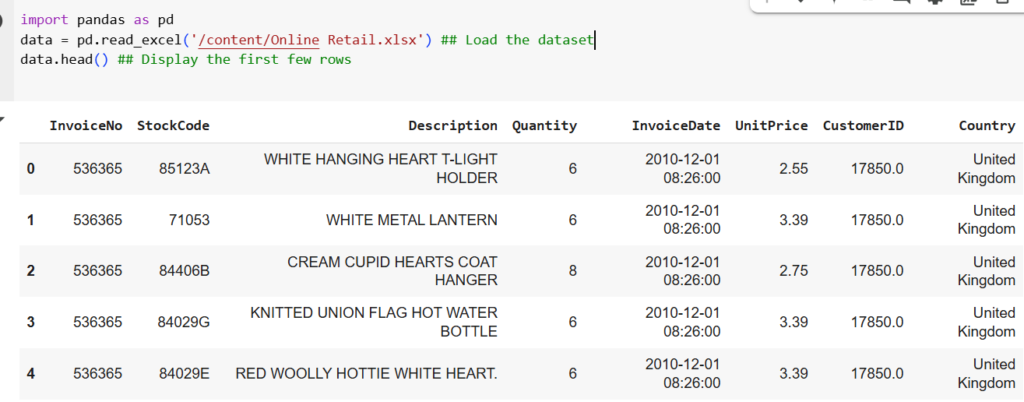
Let’s perform the market basket analysis using python on the publicly available dataset “Online Retail Dataset”, which contains transactional data for a UK-based online retailer.
To import the dataset in Python, we use the Pandas library, which provides tools for data manipulation and analysis. After importing the dataset, Pandas functions like head(), df.shape, and describe() can be used to explore the dataset’s contents.
Data Cleaning
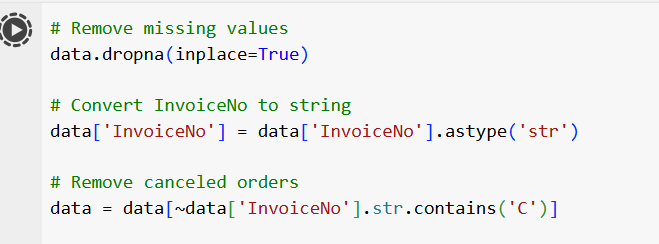
Data cleaning involves removing any irrelevant or inconsistent data from the dataset. It’s important to clean and preprocess the transaction data to make sure it’s in the right format before doing market basket analysis using python. The following are some typical procedures for data cleaning:
- Removing empty spaces in the descriptions.
- Dropping rows with missing invoice numbers.
- Making a String Out of the Invoice No.
- Removing rows from the invoice number that contain the letter “C,” which indicates a credit transaction
Creating the Basket Data for Transactions for a Specific Country
France has a greater range of items, making it a more comprehensive dataset to work with. Thus, in this case, we have decided to restrict the dataset to only transactions that took place in France. This basket will contain the number of each item bought per transaction.
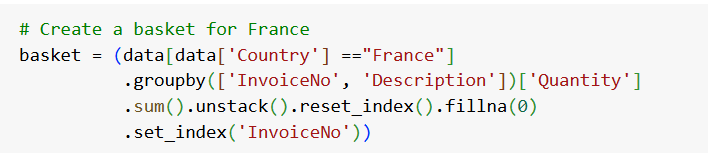
The code explanation:
- data[data[‘Country’] ==”France”]: filters the original dataset ‘data’ to include transactions from France only.
- .groupby([‘InvoiceNo’, ‘Description’])[‘Quantity’] .sum(): groups the transactions by InvoiceNo and Description, and calculates the sum of Quantity for each group. This gives the number of each product purchased per transaction.
- .unstack(): pivots the grouped data so that each product becomes a column and each row represents a transaction.
- .reset_index(): resets the index of the DataFrame so that the InvoiceNo column becomes a regular column.
- .fillna(0): fills any missing values (i.e., transactions where a product was not purchased) with 0.
- .set_index(‘InvoiceNo’): sets the InvoiceNo column as the index of the DataFrame.
The resulting DataFrame, ‘basket’, contains binary values. It represents whether or not a product is purchased in each transaction. The rows represent each transaction (indexed by InvoiceNo) and the columns represent each product.
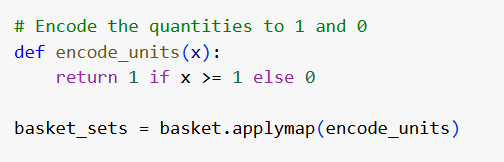
One-Hot Encoding
One-hot encoding is the process of converting categorical data variables into numerical values.
A function ‘encode_units(x)’ is defined to label the values for one-hot encoding. A value x is assigned the value of 1 if it is higher than or equal to 1, else a value of 0 is assigned. The function encode is then applied to the basket DataFrame using the applymap method, which applies the function to each element of the DataFrame. The binary values 0 and 1 in the resulting DataFrame, ‘basket_sets’, indicate whether or not an item was bought in each transaction.
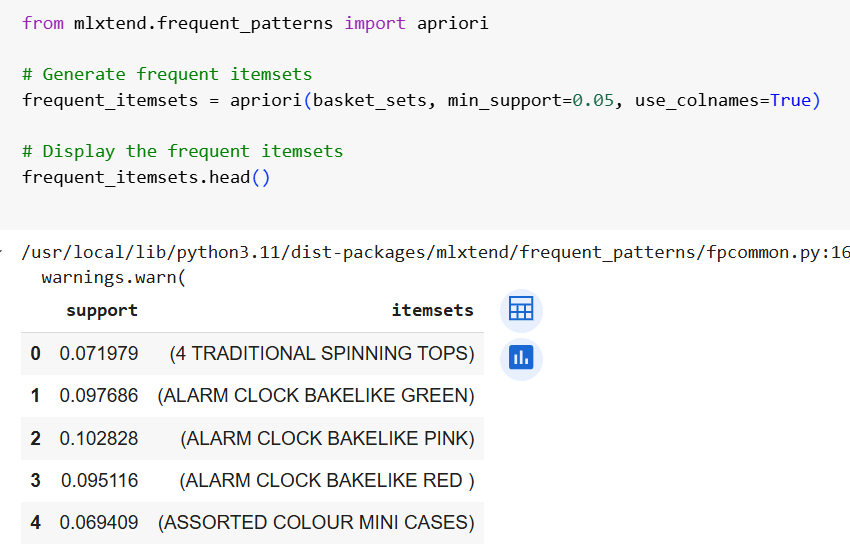
Apply Apriori Algorithm
The Apriori Algorithm is one of the algorithms used for market basket analysis using python. We will mine frequent itemsets using ‘mlxtend’. This code snippet applies the Apriori algorithm to the one-hot encoded transaction dataset basket_sets using the apriori function from the mlxtend.frequent_patterns module.
Visualize the Association Rules
Association rules uncover interesting patterns and insights in the dataset, such as which items customers frequently purchase together or which items certain customer segments often buy. Marketers and business teams can use these insights to shape marketing strategies and enhance business operations.
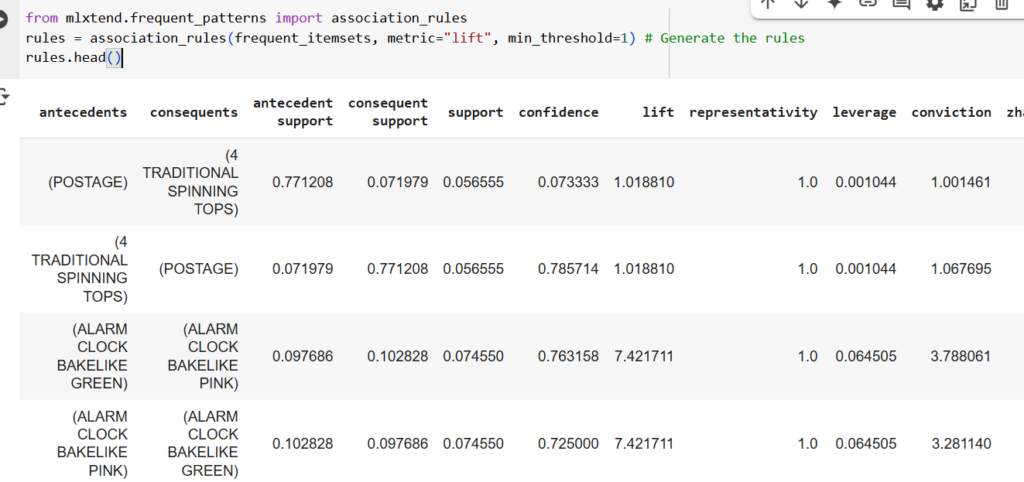
In this code snippet, the ‘association_rules’ function returns a DataFrame of association rules with their corresponding ‘support’, ‘confidence’, and ‘lift values’. The rules variable is used to store this DataFrame. The head() function is then called on the rules DataFrame to display the first few rows of the DataFrame.
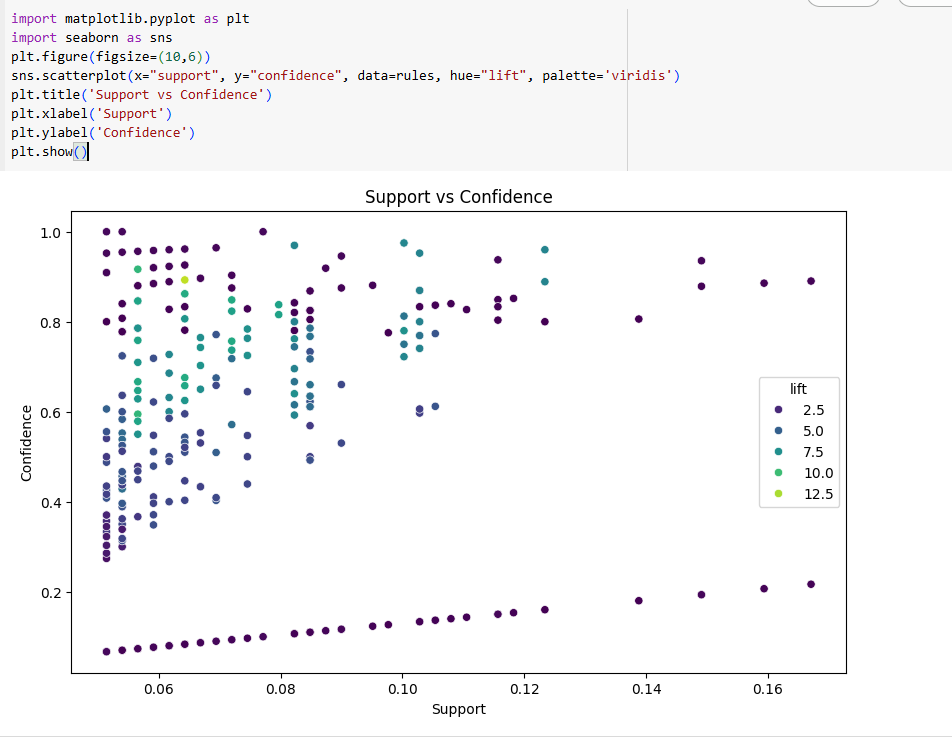
This scatter plot visualizes the association rules generated by the Apriori algorithm, specifically mapping:
- X-axis: Support means how frequently an itemset appears in the dataset
- Y-axis: Confidence means the probability that the rule’s consequent is purchased when the antecedent is purchased.
- Color (hue): Lift means strength of the rule (higher = stronger association)
What Information Does this Plot Give?
This scatter plot gives us the following information.
- High Confidence, Low Support (top-left) These rules are highly reliable but apply to narrow segments (i.e., they occur rarely but almost always hold when they do). Good for niche recommendations.
- High Support & Confidence (upper-right)
Very strong rules, these are the most reliable and frequent associations.
- High Support, Moderate Confidence (mid-right) Common itemsets, but not always followed by the consequent. These may be popular combinations but not strongly predictive.
- Color gradient = Lift
- Dark blue/purple: Lower lift (<3), weaker associations
- Light green to yellow: Higher lift (>7), strong positive correlation.
- Dense lower-left Rules that occur infrequently and aren’t strong predictors, often noisy or weak associations.
This scatter plot helps identify actionable rules for retail strategies, not just popular item pairs, but statistically significant ones that uncover customer buying patterns.
Final Thoughts
Market Basket Analysis is more than just a data mining technique—it’s a practical tool for driving smarter business decisions, optimizing retail strategies, and enhancing customer experience. Whether you’re a student building your portfolio or a professional aiming to deliver data-driven value, mastering this market basket analysis using python is a powerful skill.
If you’re looking to take your data skills further with real-world projects like this, consider exploring the hands-on bootcamps and mentorship programs offered by WeCloudData, where data science meets career transformation.
What WeCloudData Offers
- WeCloudData’s Corporate Training programs aim to meet the needs of forward-thinking companies. With hands-on, expert-led instruction, our courses aim to bridge the skills gap and help your organization thrive in today’s data-driven economy.
- Live public training sessions led by industry experts
- Career workshops to prepare you for the job market
- Dedicated career services
- Portfolio support to help showcase your skills to potential employers.
- Enterprise Clients: Our expert team offers 1-on-1 consultations.
Join WeCloudData to kickstart your learning journey and unlock new career opportunities in Artificial Intelligence.
