
The Recap
We continue with the unfolding saga of the data science jobs landscape, this time for the month of November. In my previous blog, I continued to compare Toronto’s data science jobs market against the rest of North America, and after a strong September, it didn’t look especially good for Toronto. It looked as if North America may have gotten the better of Toronto.
Toronto continued to hold its ground in job postings, even experiencing a spike in October. However, in the domain of salaries, it faced a dip, slipping from fifth to eighth place among the major North American cities. This comparison however had to be tempered with a bit of uncertainty since only a fraction of Toronto jobs disclosed pay information.
It Was the Best of Times, It Was the Worst of Times
What a difference a month makes. Toronto enjoyed an incredibly strong showing and solidified, and even elevated its status as a prominent data science hub. But the story that emerges isn’t just about Toronto’s triumphs alone; it’s also a narrative of stark distinctions, revealing the challenges that have confronted the broader North American job market.
With that said, prepare yourself for a page turning account of the contrasting trajectories of Toronto’s meteoric rise and the perplexing downturn in the North American data science job landscape. Prepare yourself for ‘A Tale of Two Markets’.
Chapter 1: A New North American Jobs King
In the previous blog, there was something particularly interesting about Toronto’s job numbers. It continued to provide the third most job postings among North America cities. However, a closer look at the data revealed a very positive upward trend. No major North American city, other than Toronto, had managed to increase its number of job postings from September.
And in this month, Toronto continued its upward trajectory, while the other North American cities continued their decline. So, on the heels of this strong showing, Toronto moved from third to first in overall job postings since the data began to be collected four months ago.
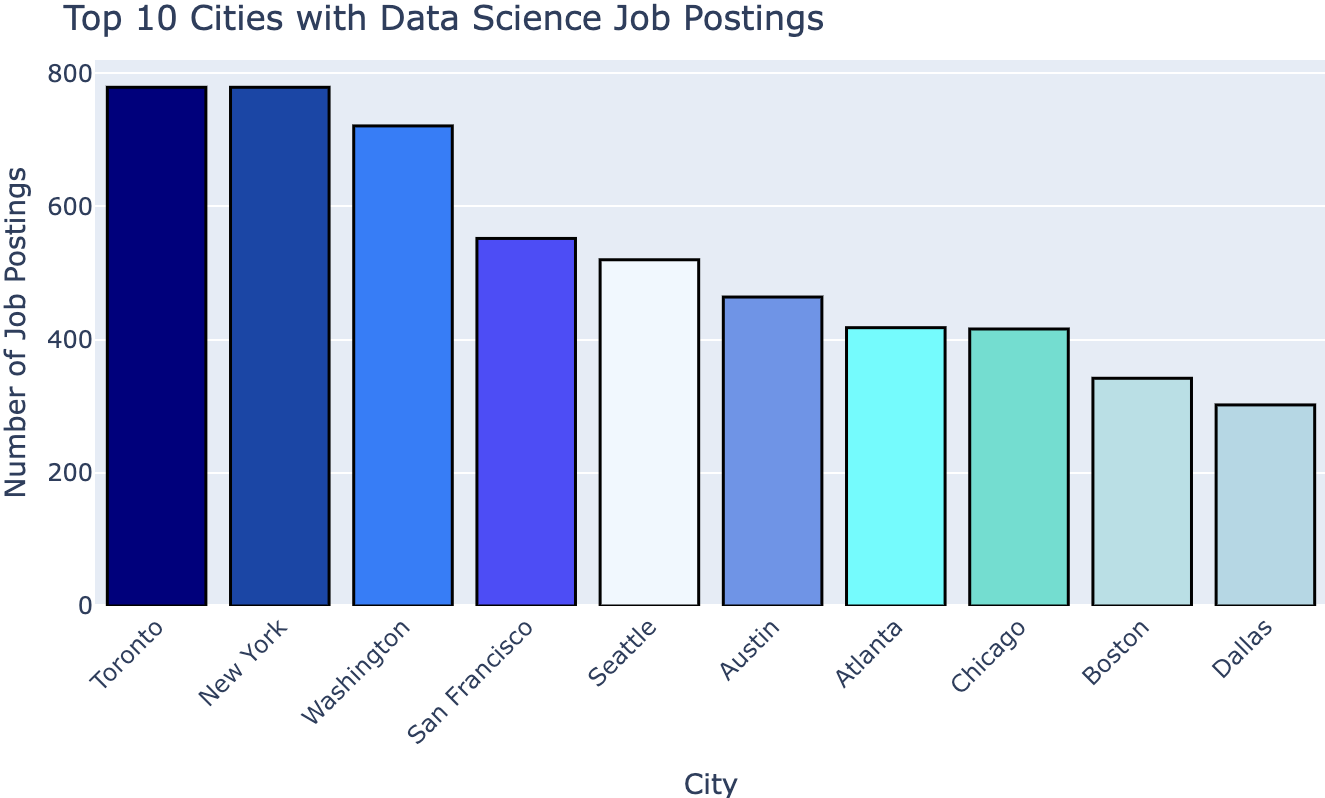
Okay, well technically it’s a first place tie between Toronto and New York, each having 779 postings, but this feat becomes even more impressive when we examine just how exceptional Toronto has been lately.
This is the second month in a row that Toronto had the largest number of job postings. That said, New York still had 90 more job postings overall with 623 postings to Toronto’s 532. Yet, Toronto made up the difference with 245 postings this month, while New York could only manage 155.
The rise of Toronto and the gradual decline of New York, and the other major North American cities for that matter, becomes evident when we look at the month to month performance of each city. After a dip in September, and everyone dipped in September, Toronto has increased the number of postings month after month.
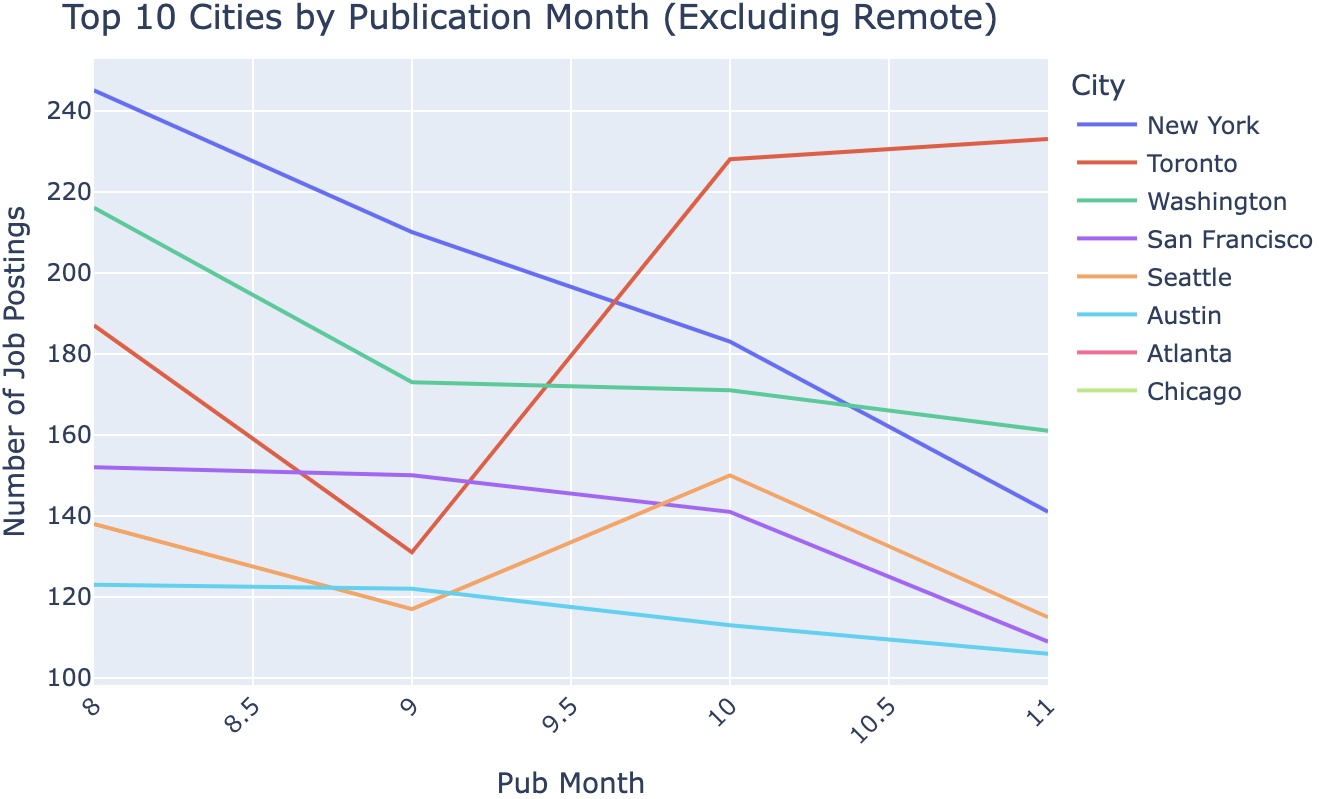
Among the North American cities, Seattle had a brief uptick in October but has since regressed. Other than that, the numbers among the top North American players have gone in the wrong direction. Just putting it out there, but, could this latest downturn reflect a larger decline with the American jobs market?
Chapter 2: A Closer Look at Job Types
I just wanted to briefly touch on the type of jobs that make up the number of Toronto postings. In doing so, I think Toronto shines even more.
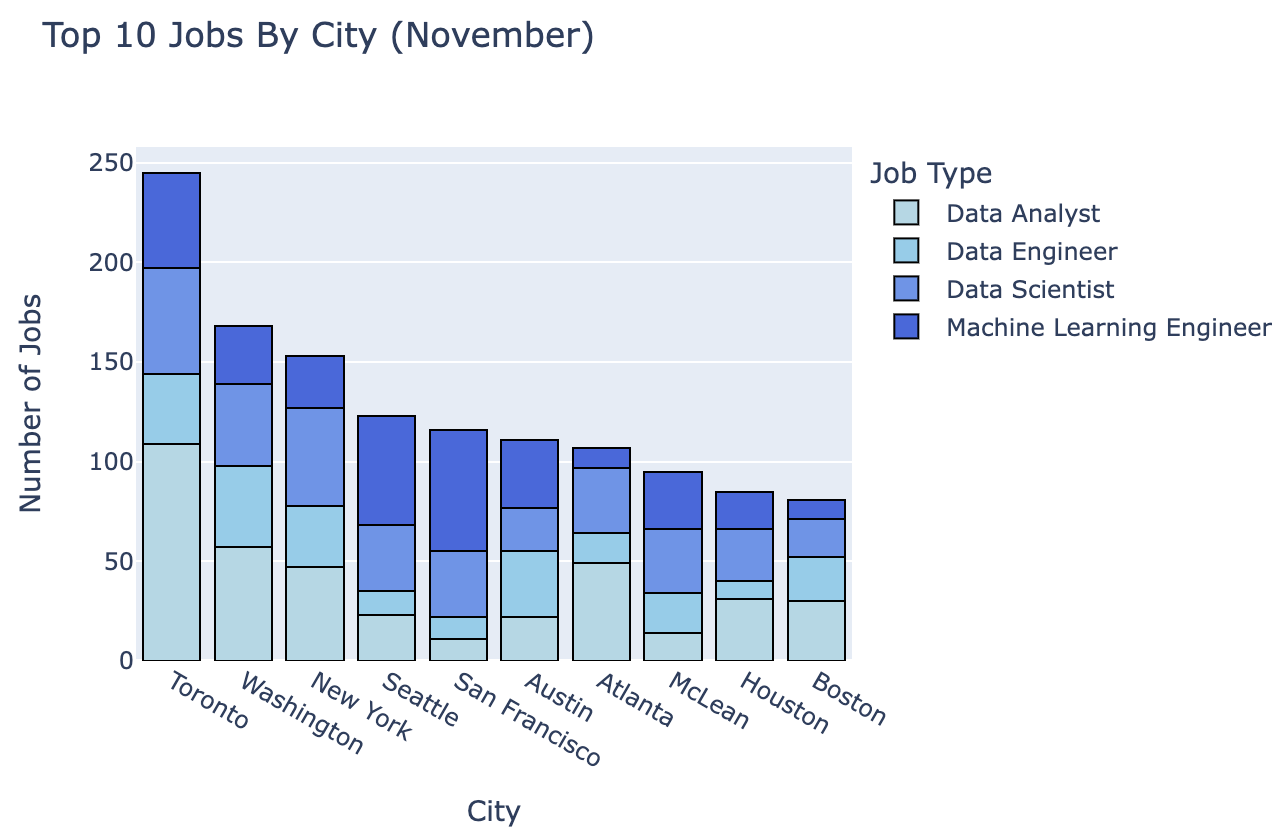
Of the 245 job postings from this month, they breakdown along job types as follows:
- 109 were for Data Analyst positions, or 44% of all jobs
- 35 were for Data Engineering positions, or 14% of all jobs
- 53 were for Data Scientist positions, or 22% of all jobs
- 48 were for Machine Learning Engineering, or 20% of all jobs
If we take those hard numbers against the other top ten cities, then
- Toronto had the most Data Analyst positions, more than doubling Atlanta’s second place total of 49.
- It even had the largest number of Data Science positions at 53; beating out New York (49) and Washington (41) for second and third place
- When it came to Machine Learning Engineering job postings, Toronto placed third (48) after San Francisco (61) and Seattle (55)
- Toronto’s lowest posted job title, Data Engineering, was still good for second place after Washington (41)
Something else I’d like to point out is that the number of postings for Machine Learning Engineering is up significantly for Toronto and it appears to be catching up to the general North American demand.
- In the previous three months, MLE postings made up about 14% of all Toronto postings.
- Taking in November, the percentage increased to 20%
- In the previous three months, North American MLE postings made up 18% of all data science jobs
- The percentage for this month for North America was 19%
For those that have been following this blog, you’ll note my prediction about the increase of MLE jobs given the rise of AI and LLMS. It seems like it’s coming true, if just even in Toronto. But I digress. Back to our story and its next chapter…
Chapter 3: Quality and Quantity
I feel like that subtitle would have been a Jane Austen title, if she were into assessing numbers instead of exploring the dependence of women on marriage for social standing and economic security in the early 19th century, but I digress again!
Now the question remains, is this quantity of job postings matched with equally impressive compensation? The tentative answer is yes, but as always with Toronto, it’s hard to say for certain. In the three preceding months the percentage of captured salaries has averaged out to be 12%. This is in stark contrast to the North American market where 41% of job postings are accompanied with a salary.
Having said that, there is cause for optimism and reassurance around Toronto salaries, however slight. With its largest amount of monthly jobs, Toronto also returned the highest percentage of captured salaries than in any other month at 18%. Again, it’s not ideal, but it’s certainly more to go on than in previous months.
So then, how is Toronto looking relative to its North American counterparts? Pretty good!

It managed to recapture its fifth place standing. Last month it fell to eight place with an average that came in around $102 000. With this month’s salary numbers, the average salary rose back up to $109 800. Meanwhile, San Francisco and Seattle continue to lead the way in average salary.
Toronto looks even better when we compare it to North America when it comes to quantile range.

In the chart above, you can see Toronto outpacing the general North American market at quantile ranges from 0 to 0.75.
Also if we look at averages over the four month period we can see that Toronto holds a sizable economic advantage when it comes to average salary at $109 800 compared to $102 200.
Just a side note: I don’t prefer to post a monthly comparison between Toronto and North America given that the monthly sample size for Toronto is too small/unreliable.
Having talked about salaries, we turn our attention now to the companies who pay them.
Chapter 4: You’re Hired!
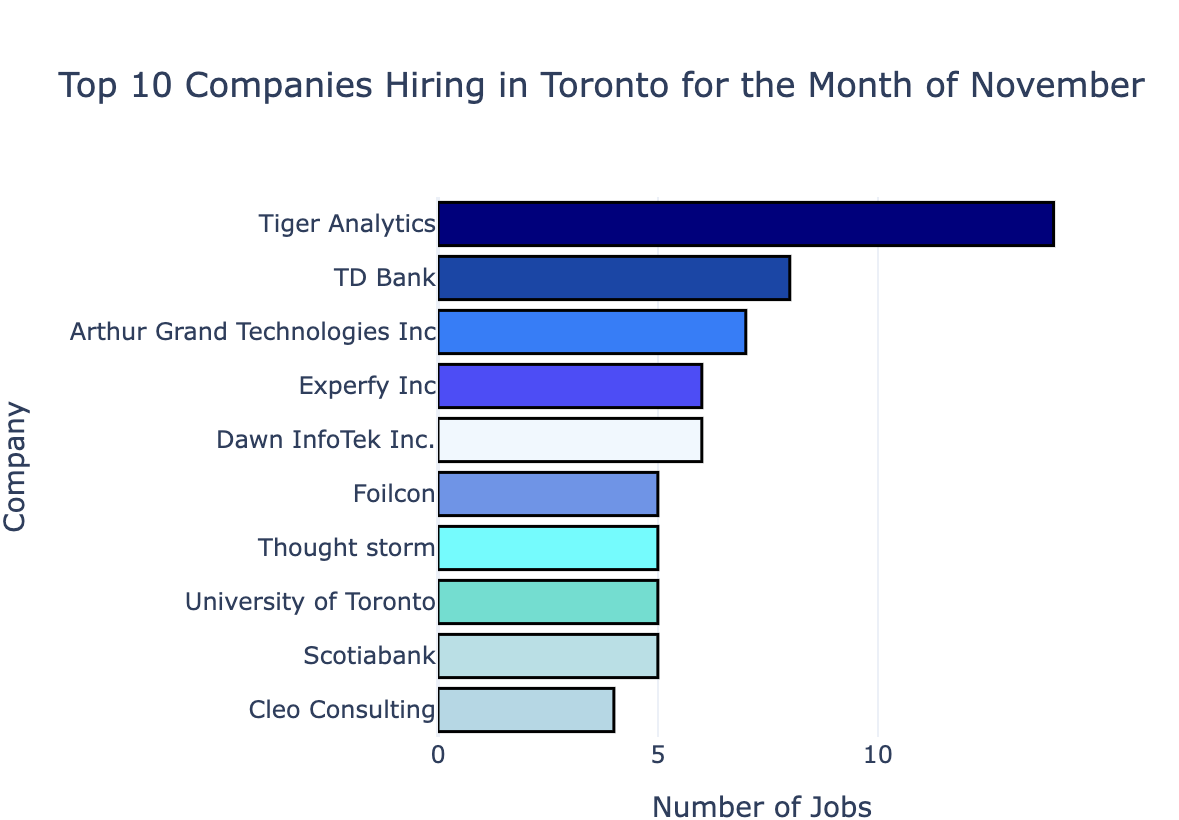
So who was hiring this month? Who was defining the jobs landscape? Well overall, the Toronto market continues to be dominated by the banks and financial services, most notably TD with its steady four months of continued postings.
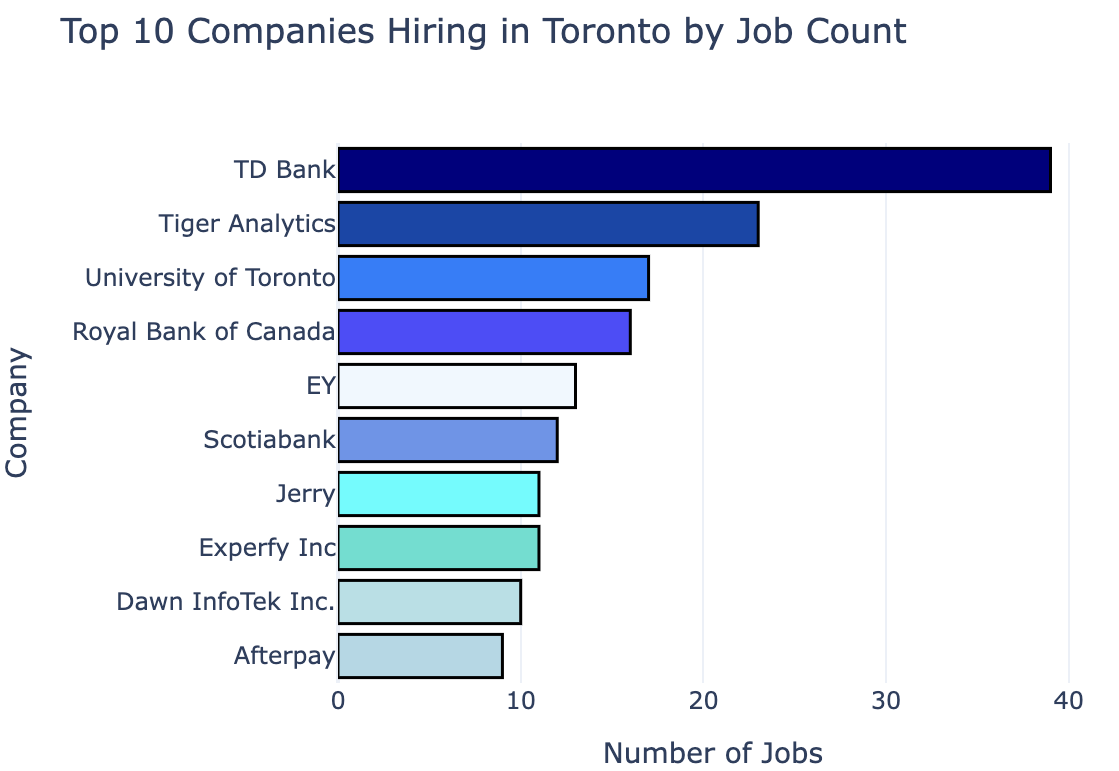
And while TD has a respectable showing this month, the big winner is Tiger Analytics, an AI and analytics company.
When looking at North America, not much has changed since last month. The overall leaderboard is still populated with big tech, government intelligence agencies and finance/banking.
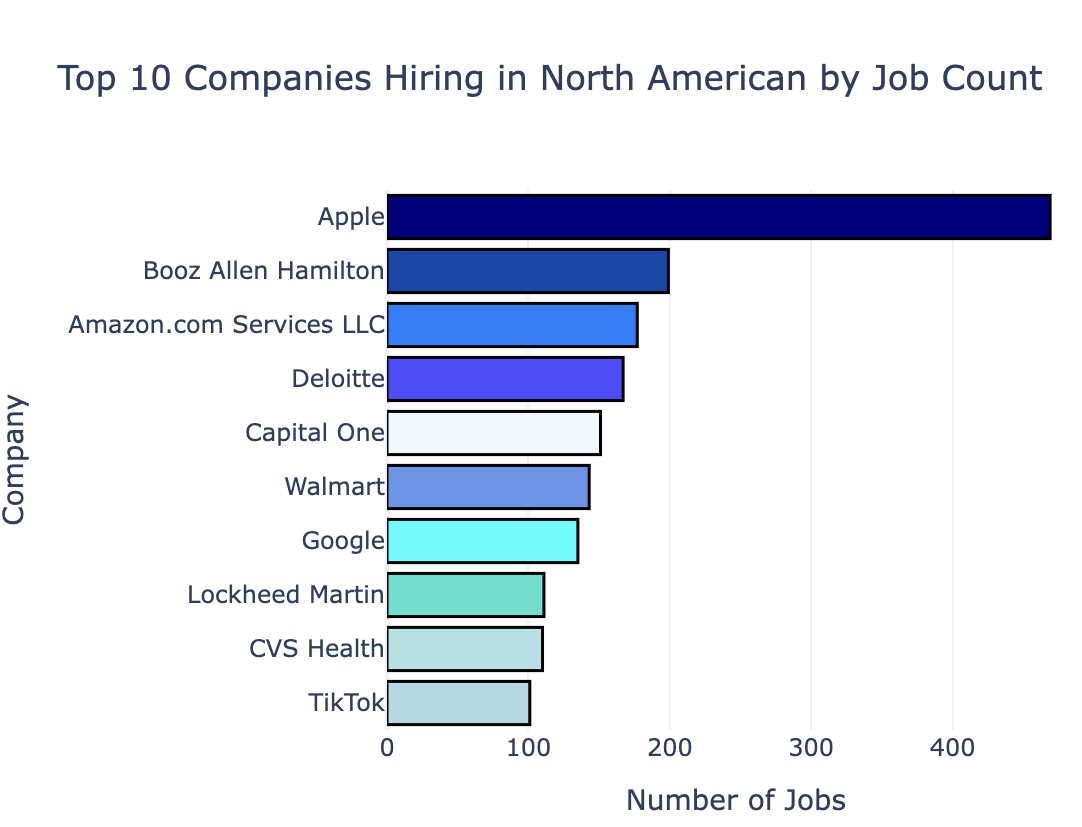
It pretty much looks the same when looking at this month alone, except for maybe the notable addition of Microsoft into the top 10.
And with that little bit of information we draw our story to a conclusion
Closing the Chapter:
As we conclude this chapter in the ever-evolving narrative of the data science job market, November has delivered unexpected plot twists that have reshaped the story’s trajectory. Toronto’s ascent in this tale is nothing short of spectacular. Its meteoric rise, marked by a surge in job postings and a noteworthy presence in key job types, paints a tale of triumph and the city as a preeminent data science hub.
On the flip side, the broader North American job market has found itself grappling with a complex and, at times, perplexing set of challenges. Major cities have witnessed a decline in job postings, raising questions about the overall health of the industry. This contrasting backdrop, where Toronto basks in its successes while the rest of North America faces uncertainty, sets the stage for a narrative that continues to intrigue and captivate.
As we unveil the key figures in this unfolding narrative, the architects of Toronto’s triumph come into focus. Among them, Tiger Analytics, an AI and analytics firm, emerges as a prominent player in the city’s job market. Yet, the overarching scene retains its well-known features, with major banks and financial institutions, spearheaded by TD, maintaining their stronghold in this ever-evolving story.
Meanwhile, across North America, the stage is occupied by familiar faces as well. Big tech giants, government intelligence agencies, and finance and banking institutions maintain their stronghold in the top ranks. A notable addition for the month of November is Microsoft, making its presence in the top 10 largest hiring companies.
Given Toronto’s remarkable performance and the enigmatic shifts in the North American market, the anticipation for the next installment grows. As we turn the page to explore the chapters that lie ahead, the stage is set for an enthralling continuation of Toronto’s data science journey. Will this ascent be sustained? Can it reshape the landscape? These are the questions that will define our narrative. However, as we await the unfolding of this data science tale, one thing is clear: Toronto’s remarkable ascent has set the stage for “Great Expectations.”
