
You are in the market to buy your dream house. What’s the next step? Naturally, you’d examine the real estate market, analyzing trends and historical prices. You aim to pinpoint the perfect timing to secure the best value for your investment. This is where machine learning and Artificial Intelligence (AI) come into play. With the wealth of data now available, these technologies can be harnessed to assist investors and real estate professionals in making informed, data-driven decisions. By applying AI and machine learning, you can navigate the complexities of the market with greater precision and confidence.
Moreover, recent years have seen growing concerns regarding racial discrimination in home value appraisals. To address this, the integration of machine learning offers a promising solution. By analyzing large datasets without human biases, these technologies can provide more objective and equitable property valuations, challenging the traditional methods that have long dominated the industry. Additionally, according to the McKinsey Global Institute (MGI), generative Artificial Intelligence (AI) could generate substantial economic value for the real estate industry, potentially ranging from $110 billion to $180 billion or more. This estimation highlights the immense potential and financial benefits that AI-driven innovations could bring to the real estate market, further emphasizing the need for the sector to adopt and adapt to these advanced technological solutions [1].
For several decades, to estimate the sale price of residential properties, appraisers have been walking through the properties, observing the property, collecting data, and making use of the hedonic pricing models. However, this method bears some costs and, by nature, is subjective and biased [2]. Hedonic pricing is a model used to estimate the economic value of a product or service by analyzing its characteristics and features. This method is particularly common in the real estate industry, where it helps determine property prices by considering various factors, such as size, location, amenities, and environmental characteristics.
Accurate home sale price prediction is essential for the real estate market. Besides buyers and sellers, the housing market includes several other stakeholders, local and state government, real estate dealers, financial institutions, and market predictors. The real estate domain is also an important part of the economy that can drive up and down the stock exchange market and even generate disruptive economic events. This was experienced not long ago when the subprime mortgage crisis ultimately led to the depreciation of the real estate market and caused a worldwide recession [3]. The recession emphasized the need for better market prediction, particularly in the real estate domain. In periods of economic expansion, construction and employment in the real estate sector grow significantly and result in higher property prices [4]. The trend reverses in periods of economic contraction. Nevertheless, accurate prediction of the real estate market would be significant for socio-economic development at local and national levels. Machine learning (ML) has been used in many domains for prediction purposes and should be an asset for real estate market prediction, as well. Properly trained algorithms could help with accurate home sale trends if market characteristics are accurately accounted for [5].
Please note that the aim of this article is to showcase the practical utility of machine learning in enriching our everyday lives, rather than to explore its technical complexities. We aim to highlight the intriguing applications of machine learning in real estate price prediction, with an objective of sparking interest that encourages further exploration into data science and machine learning. That being said, let’s take a look at some code snippets to see machine learning in action for spam detection using machine learning.
Some of the code snippets in this article are sourced from a Kaggle notebook by Sohaila Diab, titled “Real Estate Price Prediction”. Kaggle is a platform that provides a community for data scientists and machine learning practitioners to explore, analyze, and share quality data sets and build machine learning models. It offers a collaborative environment where users can participate in competitions, access a broad range of datasets, and gain insights from other professionals in the field.
Continuing from our previous discussion on Kaggle, the code snippets below set up the foundation for a machine learning project focused on real estate price prediction.

The code below loads datasets from a specified path on Kaggle into a Pandas DataFrame, which is a structure used for data manipulation in Python.

The .head() function is used to display the first five rows of this dataset as shown in the code snippet below.

Top five rows overview:

The original dataset contains the following features (also referred to as attributes or column names):
- No: A unique identifier for each data entry.
- X1 transaction date: The date of the property transaction.
- X2 house age: The age of the house in years.
- X3 distance to the nearest MRT station: The distance in meters to the nearest Mass Rapid Transit (MRT) station.
- X4 number of convenience stores: The number of convenience stores within walking distance.
- X5 latitude: The geographical latitude of the property.
- X6 longitude: The geographical longitude of the property.
- Y house price of unit area: The house price per unit area.
These features provide information about real estate transactions, including the physical attributes of properties, their locations, and the sale price per unit area. To explore deeper into the dataset and extract meaningful insights, we turn to summary statistics.
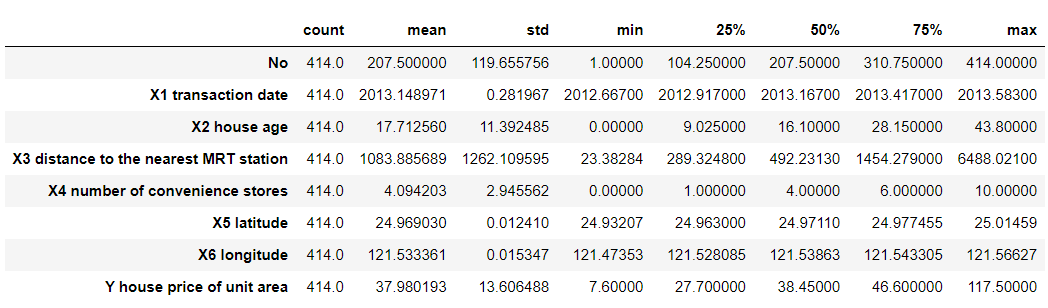
Examining summary statistics is beneficial because it provides a quick overview of key characteristics of the numerical data. The code below generates summary statistics for the numerical variables within the
dataset and transposes the result to display it in a more readable format.
These statistics include measures like mean (average), standard deviation (a measure of data spread), minimum, maximum, and quartiles. They help data analysts and scientists understand the central tendency, variability, and distribution of the data, which is crucial for making informed decisions about data preprocessing, feature selection, and modeling. Summary statistics also aid in identifying potential outliers or unusual patterns in the data.

Here’s what the .describe() method does:
- Count: Shows the number of non-missing entries in each column.
- Mean: Provides the average value for each column.
- Std (Standard Deviation): Indicates the amount of variation or dispersion in each column.
- Min: The smallest value in each column.
- 25% (First Quartile): The value below which 25% of the data falls.
- 50% (Median): The middle value of the dataset.
- 75% (Third Quartile): The value below which 75% of the data falls.
- Max: The largest value in each column.
Overview of dataset characteristics with the .describe() method:
Having showcased the value of summary statistics via the .describe() method for understanding the core trends and variations in our data, we now broaden our view by exploring metadata. This approach will further deepen our insight into the data’s framework and attributes (column names or features), enriching our comprehension of the dataset’s nuances and intricacies.
Metadata

Metadata provides an overview of the dataset itself; it’s the data about the data. Metadata provides a high-level summary about the characteristics of the dataset. It includes details such as the column names, the types of data contained in each column (numerical, textual, etc.), and the count of non-null entries in each column, among other aspects. The code snippet below is typically utilized to retrieve the metadata of a dataset.

Upon executing the code, a succinct summary is displayed, offering valuable insights into the various data types present and the memory usage in the dataset. This information is crucial for deeper analytical efforts. The output generated might begin as follows:

- Range Index: The dataset is indexed from 0 to 414, providing a unique identifier for each row, represented by the “No” column.
- Columns: There are a total of 8 columns, each representing a different feature or attribute related to the property and its sale.
- Column Details: Each column’s non-null count matches the total number of entries, indicating no missing values in the dataset.
- Data Types: The dataset consists of numerical data, including float (for transaction date, distance to the nearest MRT station, latitude, longitude, and house price of unit area) and integer (for number of convenience stores) data types.
- Memory Usage: The dataset consumes 26.0 KB of memory.
One of the primary responsibilities of a data scientist or machine learning practitioner involves communicating findings to stakeholders. Therefore, an integral part of their role is to create visualizations that convey insights derived from data analysis, ensuring that the information is accessible and understandable.
To illustrate this point, let’s take a look into a couple of visualizations:

Price Distribution by Convenience Store Access: The image above displays a box plot created from the real estate dataset, highlighting the distribution of house prices in relation to the number of convenience stores nearby. The central rectangle (the “box”) of each plot represents the interquartile range (IQR), with the median price indicated by a line within the box. Outliers are shown as individual points outside the box. The size of the box reflects the price range for properties with a specific number of convenience stores, with wider boxes indicating greater variability in prices. This type of visualization helps to quickly identify the median, variability, and potential outliers in the pricing data, emphasizing key statistical aspects of the property values in relation to accessibility to convenience stores. The diverse spread and the different positioning of the boxes offer an intuitive understanding of the market dynamics and pricing trends in the dataset.

Age Distribution of Properties: The image above showcases a histogram created from the real estate dataset, illustrating the distribution of house ages. Each bar in the histogram signifies the number of properties within specific age intervals, where taller bars indicate a higher occurrence of properties of certain ages. This visualization allows for a quick assessment of the most prevalent age ranges for houses, showing both the concentration and scarcity of properties at different ages. It provides insights into the age profile of the housing stock, revealing patterns and tendencies in the age of properties on the market. The differing heights of the bars and the overall layout of the histogram convey the age diversity within the real estate sector, facilitating an easy grasp of the age dynamics in the property market.
Given the clarity that visualizations provide in demystifying complex data, our focus shifts to the realm of feature engineering. In this phase, we refine and transform data to further enhance model performance.
Feature Engineering

In the context of real estate price prediction using machine learning, feature engineering plays a crucial role in enhancing predictive power of the models. This process involves transforming the raw dataset, which includes various attributes of properties like age, location, size, and price, into a structured format more suitable for analysis by machine learning algorithms. This enhancement is crucial to improve the model’s accuracy in predicting real estate prices, thereby aiding in more effective market analysis and decision-making. Good feature engineering is a foundation for learning algorithms, transforming raw data into informative features that simplify the forecasting task and yield better results [6].
For feature engineering in our real estate dataset, several actions are typically considered. These include extracting significant attributes from the data, such as the property’s age, proximity to transport stations, number of convenience stores, and geographical coordinates. Handling any missing values carefully to maintain the dataset’s integrity is also essential. Additionally, numerical encoding of categorical variables (if present) and standardization or normalization of numerical values to ensure uniformity in scale are common practices. Although the dataset in its raw form may already present these features in a structured manner, these transformations are important in preparing the data for machine learning analysis.
Feature engineering can also include making new features by using methods that pull insights from the location or combining related data to make better predictors. For instance, we could create a feature that scores a property’s accessibility based on how close it is to important places like shops or train stations. It’s important to pick out the features that really help in making accurate predictions. By carefully improving the dataset with these techniques, we boost the model’s ability to spot important patterns that affect property prices, leading to more precise predictions. Choosing the right features makes the model simpler and more effective.
Key elements of feature engineering for real estate price prediction include:
- Data Extraction and Refinement: Isolating crucial characteristics from the dataset that significantly influence property prices, like square footage, age of the property, and location attributes.
- Feature Transformation: Converting any non-numeric data into a format suitable for machine learning models, and applying normalization or standardization where necessary to bring all features onto a comparable scale.
- Feature Creation and Selection: Developing new features by analyzing and synthesizing existing data to uncover additional insights, or by transforming complex data into more straightforward, analyzable forms. This step also involves selecting potent features that sharply increase the model’s predictive power.
- Optimization for Predictive Accuracy: Refining the dataset to bolster the model’s capacity in discerning price-influencing factors, thereby enhancing the accuracy and reliability of its predictions.
Having explored the feature engineering process, the next phase is Model Training, where we utilize the processed dataset, now equipped with finely tuned features, to instruct the machine learning model on recognizing the patterns that affect real estate pricing. With this foundational work in place, we are now ready to advance to the topic of training the model.
Training the Model

After the dataset has been refined through feature engineering, we move to the Model Training stage for real estate price prediction. In this crucial phase, the machine learning model “learns” to differentiate between the various factors that can affect property prices, such as location, age of the property, proximity to amenities, among others. The enriched dataset is split into training and testing sets. This split is essential to train the model on a specific portion of the data, while using a separate set to test and validate its predictive accuracy.
As highlighted earlier, the goal of this article is not to delve deeply into the technicalities of machine learning but to illustrate its practical application in everyday scenarios, such as real estate price prediction.
The subsequent code examples will provide a foundation for the steps involved in training a machine learning model for real estate price prediction. Although these snippets may not form a complete machine learning solution, they offer an insight into the methodology needed to develop and train a model suited for predicting property prices based on various influencing factors.


Model Interpretation

In the context of real estate prices prediction using machine learning, model interpretation focuses on understanding how algorithms analyze property data, such as location, size, age, and proximity to amenities, to optimize pricing accuracy and market analysis. This phase is vital for ensuring that the insights provided by the model are accurate, meaningful, explainable, and actionable. Explainability is important even when not explicitly required by regulators or clients, as it fosters transparency and builds trust with stakeholders [7]. Emphasizing explainability is a crucial aspect of ethical machine learning practices, highlighting its significance in the development and deployment of predictive models in real estate.
Interpreting these “black box” models in real estate can be challenging, as it necessitates the simplification of complex algorithms while retaining essential details. It goes beyond mere prediction accuracy; it involves deciphering the factors that influence property value trends and identifying patterns that might not be immediately apparent. For instance, understanding how a change in local infrastructure or community amenities affects property prices can provide valuable insights for improving market predictions and optimizing investment strategies.
Depending on the complexity of the model, other explainability techniques beyond feature importance might be used, such as SHAP (SHapley Additive exPlanations) values or LIME (Local Interpretable Model-agnostic Explanations). These techniques help to provide a more detailed and nuanced understanding of how each feature in the dataset influences the prediction outcome, thereby offering deeper insights into the model’s behavior.
Evaluating model performance in real estate price prediction involves analyzing key metrics to assess the effectiveness of the property valuation model. Model evaluation is critical, offering a quantitative measure of the model’s predictive capabilities in real estate pricing.
- R-squared (R²): Measures the proportion of the variance in the dependent variable that is predictable from the independent variables, providing an indication of the model’s goodness of fit.
- Mean Absolute Error (MAE): Measures the average magnitude of the errors in a set of predictions, without considering their direction, giving an indication of how close the predictions are to the actual outcomes.
- Root Mean Squared Error (RMSE): Measures the square root of the average of the squared differences between predicted and actual values, providing a sense of the magnitude of the error.
These metrics help determine the model’s accuracy and its practical application in real-world real estate market scenarios, adapting to the ever-changing dynamics of property valuation.
In addition to these metrics, situational metrics such as price trend analysis and market demand evaluation play a role in assessing the practical value of the model in real estate economics. They help in understanding the broader economic factors affecting property prices and assist stakeholders in making informed decisions.
Key Takeaways
This article explores the role of machine learning in forecasting real estate prices, showcasing its transformative impact on property market analysis. By examining data on property attributes like age, location, and amenities, it highlights how machine learning algorithms enhance the precision of property valuations. Furthermore, the article covers feature engineering, model training, and interpretation phases, providing a comprehensive view of the technical approaches that boost predictive accuracy. With illustrative code examples, the article demonstrates the application of these techniques in refining real estate pricing strategies and market insights. Ultimately, the article accentuates the significant influence of machine learning in real estate price prediction, encouraging readers to further investigate the integration of data science and real estate market dynamics, focusing particularly on price prediction.
Next Steps
- Technology-related roles are the fastest growing jobs in percentage terms, including Big Data Specialists, Fintech Engineers, AI and Machine Learning Specialists and Software and Application Developers [8]. This insight from the World Economic Forum’s 2025 report highlights the growing demand in these fields. To position yourself advantageously in the job market, consider WeCloudData’s bootcamps. If you are interested in learning and becoming a machine learning engineer and do not know where to start, do check Weclouddata’s AI and Machine Learning bootcamp and earn your Machine learning Certificate today! With real client projects, one-on-one mentorship, and hands-on experience in our immersive programs, it’s an opportunity to develop expertise in AI and machine learning, aligning your skills with the current and future needs of the job market. Set yourself up for success in a dynamic and rewarding career; take action now!
References
[1] The economic potential of generative AI: The next productivity frontier
June 14, 2023 | Report. Retrieved from: https://www.mckinsey.com/capabilities/mckinsey-digital/our-insights/the-economic-potential-of-generative-ai-the-next-productivity-frontier#introduction.
[2] Mahdieh Yazdani, “Machine Learning, Deep Learning, and Hedonic Methods for Real Estate Price Prediction,” Department of Economics, Colorado University at Boulder. Retrieved from: https://arxiv.org/abs/2110.07151.
[3] B. Park, J.K. Bae, Using machine learning algorithms for housing price prediction: The case of Fairfax County, Virginia housing data, Expert Syst. Appl. 42 (2015) 2928– 2934.
[4] V. Plakandaras, R. Gupta, P. Gogas, T. Papadimitriou, Forecasting the U.S. real house price index, Econ. Model. 45 (2015) 259–267. Retrieved from: https://doi.org/10.1016/j.econmod.2014.10.050.
[5] Shashi Bhushan Jha, Vijay Pandey, Rajesh Kumar Jha, Radu F. Babiceanu, “Machine Learning Approaches to Real Estate Market Prediction Problem: A Case Study,” Retrieved from: https://arxiv.org/abs/2008.09922.
[6] Rawat, T., & Khemchandani, V. (2019). Feature Engineering (FE) Tools and Techniques for Better Classification Performance. International Journal of Innovations in Engineering and Technology, 8(2). DOI: 10.21172/ijiet.82.024.
[7] Molnar, C. (2020). Interpretable Machine Learning. Retrieved from https://christophm.github.io/interpretable-ml-book/.
[8] World Economic Forum (2025). “Future of Jobs Report 2025.” Retrieved from https://reports.weforum.org/docs/WEF_Future_of_Jobs_Report_2025.pdf.
