Blog
Prompt engineering has become a key discipline for optimizing AI systems. Among the various prompt engineering techniques, role-playing prompting…
by WeCloudData
January 22, 2025
Power BI Tutorial | A Series – Part 2: Setting Up Your Workspace for Data Success
Welcome to Part 2 of our Power BI Tutorial Series! Setting up your Power BI is important before beginning to develop dashboards and data storytelling. Think of this as laying the foundation before you build the house.
Whether you’re a beginner just getting started or a business onboarding analysts across departments, this guided blog will walk you step by step through the setup process, from downloading Power BI Desktop to connecting your first dataset.
Let’s set up Power BI and begin our storytelling journey with WeCloudData- The leading data and AI training academy.
Before officially starting our environment setup, let’s make sure you’ve got everything in place:
While Power BI Desktop is free and doesn’t require an account, businesses need a Power BI Service account (Power BI on the cloud) in order to publish reports, collaborate, and share dashboards.
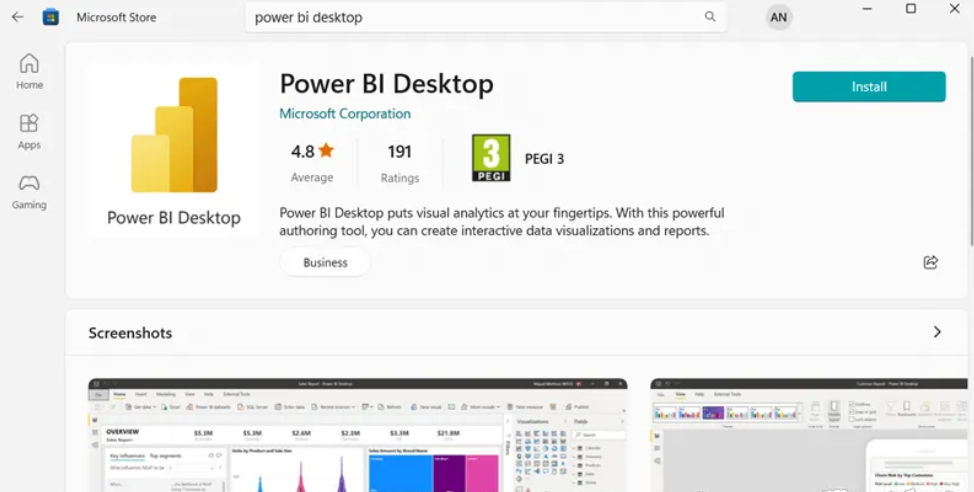
The Power BI Desktop app is where most of the development happens, like creating visuals, writing DAX formulas, and shaping data.
To get the step-by-step process of Power BI installation, follow the official documentation here.
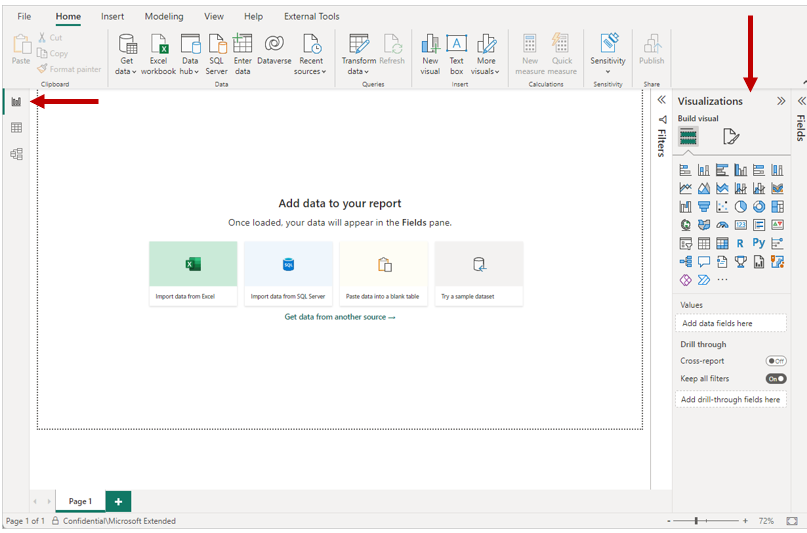
Once installed, launch Power BI Desktop. You’ll be greeted with the Welcome screen, which includes options like:
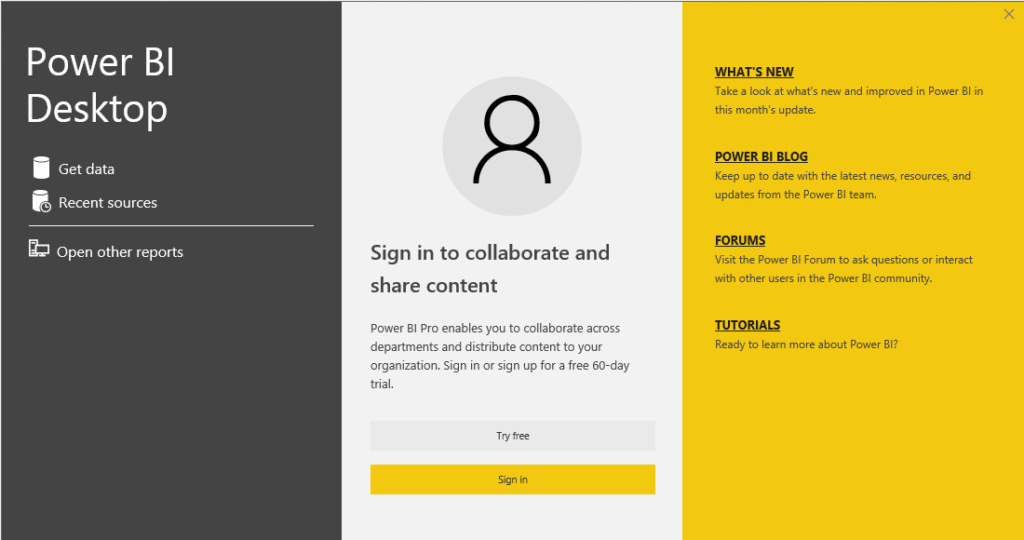
Tip: You can use Power BI Desktop without signing in. However, you will need to sign in when you’re ready to publish your report to the Power BI Service.
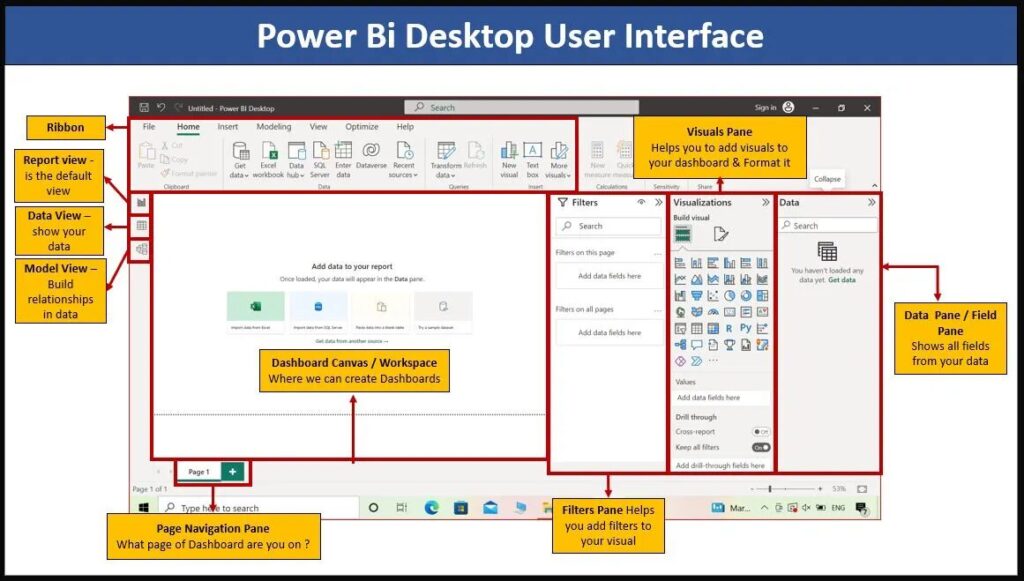
Power BI Desktop consists of Power BI Views, referred to as main components. Power BI Views have three types that help users create detailed and interactive reports.
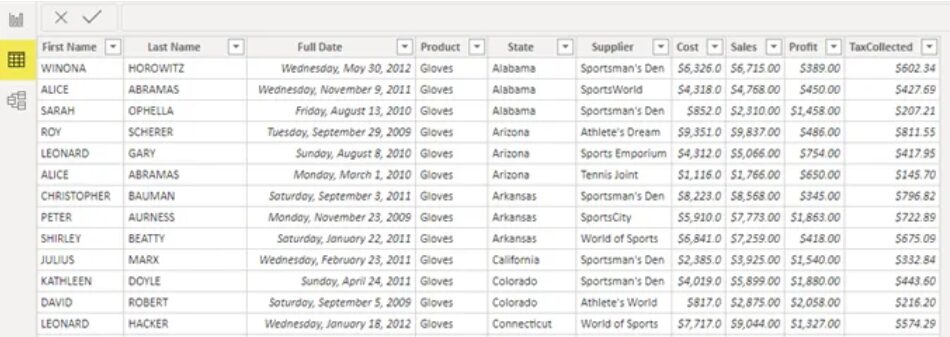
2. Data View: See your raw data in table format and check calculations
3. Model View: Manage relationships between tables and build a data model
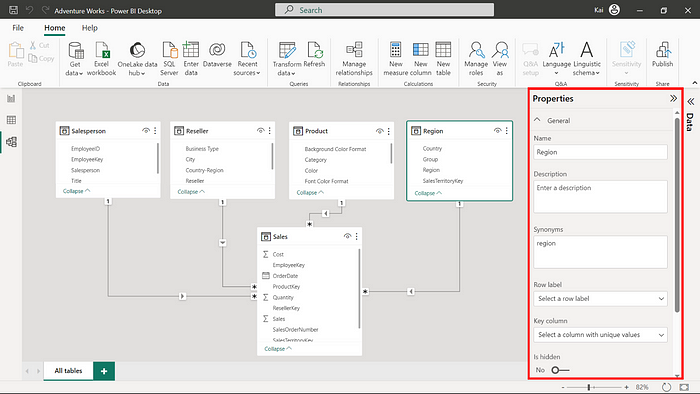
Take time to click around, Power BI’s interface is user-friendly and intuitive.
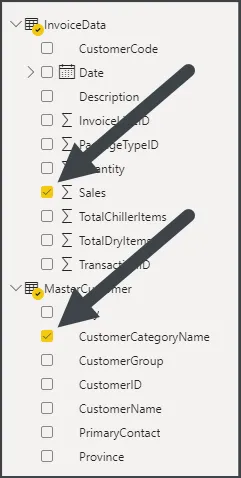
Let’s load data into Power BI so you can start experimenting.
Try this simple exercise:
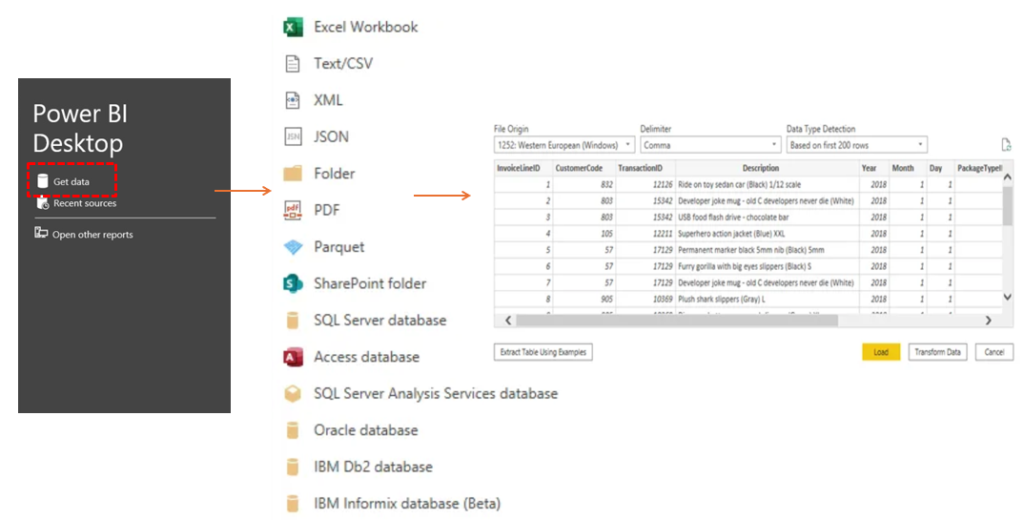
Click Transform Data to launch Power Query, which is a built-in tool in Power BI for pre-analysis data cleansing and structuring.
Here, you can:
You don’t need to be a coder to use Power Query; it’s mostly point and click.
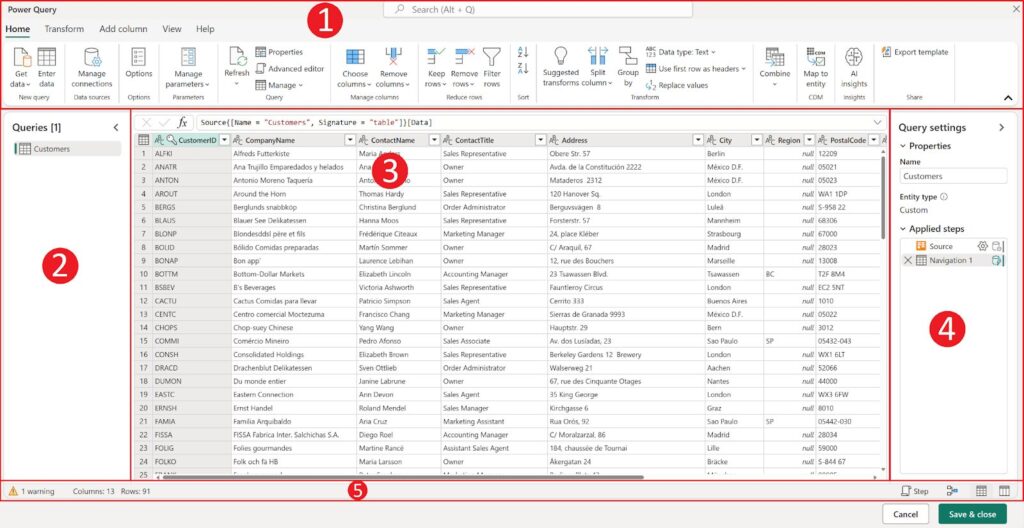
When you open Power Query, you’ll see a few important panels and tools that help you clean and shape your data:
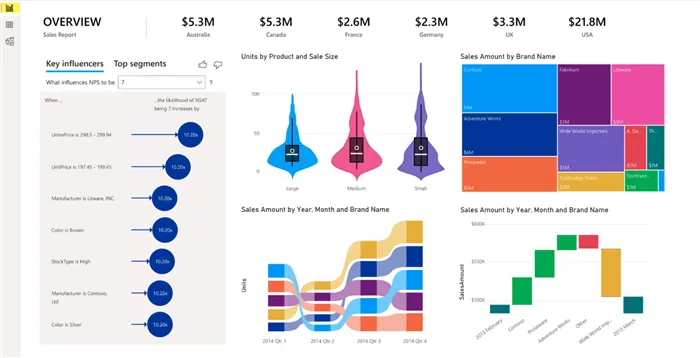
Now that we’ve loaded and transformed data using Power Query, it’s time to move into the Report View, where you’ll start turning raw data into meaningful visuals and explore Power BI data visualization.
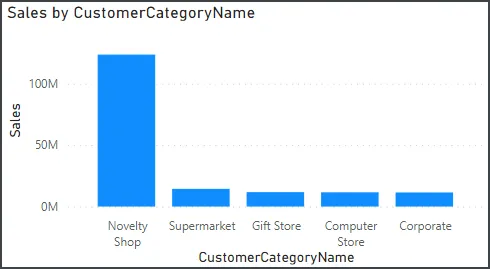
Power BI’s drag-and-drop interface makes data visualization exceedingly simple. Even if you’ve never created a report before, you’ll be able to build your first Power BI data visualization in just a few clicks.
And just like that, you’ve created your first power bi data visualization, bar chart!
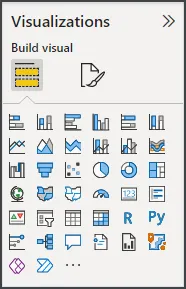
To make the report more interactive and insightful, more visualization options are there to choose from Power BI Data Visualization panel.
Want to go from beginner to job-ready or project-ready? WeCloudData offers one of the best Power BI training programs for both individuals and corporate teams.
Whether you’re a team upskilling your analysts or an individual planning a Power BI developer career path, our curriculum adapts to real-world expectations.
Here’s how WeCloudData supports future data leaders and forward-thinking organizations:
Whether you’re launching a data career or building internal BI capabilities, WeCloudData is the trusted partner to help you succeed.
👉 Ready to build your team’s data skills or start your analytics journey?
Visit weclouddata.com to explore our programs, consulting services, and talent solutions.
It’s time to establish a solid analytical foundation with data preparation and modeling now that you know how to set up your environment, connect a data source, and produce your first Power BI data visualization.
Before you start creating more complex reports and dashboards, this is an essential next step.
Part 3: Power BI Data Preparation & Modeling — Clean and Shape Your Data Like a Pro
In the next blog post of the Power BI Tutorial Series, we’ll guide you through:
Happy learning and stay tuned!
