
As you look up a house, you catch a glimpse of a glistening light and you wonder about its origin. The source of the light becomes clear as you notice an array of solar panels installed on the roof, their surfaces reflecting the sun’s rays. This sight is a testament to the growing trend of harnessing renewable energy. It showcases how solar power is being integrated into everyday life. The panels not only serve as a sustainable energy source but also represent a step forward in the use of technology for environmental conservation.
The power industry is shifting towards sustainable energy, with solar power playing a vital role in decarbonization. Companies are adapting by involving themselves in construction, installation processes, and working with utilities to develop win-win models for power generation [1].
By 2050, wind and solar are expected to account for more than three-quarters of new power capacity. Non hydro renewables are projected to make up more than a third of global power generation, a significant increase from 2014 levels [2]. By the same period, renewables could provide 65 to 85 percent of power generation. However, the build-out of renewables could face bottlenecks such as material availability, infrastructure, and labor shortages [3].
In this setting, being able to accurately predict how much power solar plants will produce is very important for keeping the balance between how much energy we have and how much we need in smart cities and communities that focus on shared energy goals. This study looks into a method called transfer learning, which is used with a specific type of machine learning model to make better predictions about solar energy production, especially with limited data. The study compares this method with traditional prediction models & finds that it performs significantly better when data is limited. This shows that transfer learning and machine learning can be a great way to improve how we predict solar energy production and improve solar energy management. This is important for managing energy distribution and meeting demand in smart cities and energy communities [4].
Please note that the aim of this article is to showcase the practical utility of machine learning in enriching our everyday lives, rather than to explore its technical complexities. We aim to highlight the fascinating applications of machine learning in solar energy forecasting. With an objective of sparking interest that encourages further exploration into data science and machine learning.
That being said, let’s take a look at some code snippets to see machine learning in action for data analysis on solar energy
The code snippets for solar power forecasting data set in this article are sourced from a Kaggle notebook by Afroz, titled “Solar power generation forecast with 99% AUC”. Kaggle is a platform that provides a community for data scientists and machine learning practitioners to explore, analyze, and share quality data sets and build machine learning models. It offers a collaborative environment where users can participate in competitions, access a broad range of datasets, and gain insights from other professionals in the field.
Continuing from our previous discussion on Kaggle, this code snippet below sets up the foundation for a machine learning project focused on solar power data forecasting. It includes importing essential libraries, such as numpy and pandas for data manipulation, matplotlib and seaborn for data visualization. The %matplotlib inline command ensures that plots are displayed inline in a Jupyter Notebook. The warnings.filterwarnings(“ignore”) line suppresses warning messages to keep the output clean. This setup is crucial for exploring, cleaning, and understanding data before applying any machine learning models, making it a foundational step in any data science project.

The code below loads datasets from a specified path on Kaggle into a Pandas DataFrame, which is a structure used for data manipulation in Python.


The .head() function displays the first five rows of this dataset.

Top five rows overview:
The dataset contains the following features (also referred to as attributes or column names):
- DATE_TIME: The date and time of the data entry.
- SOURCE_KEY: Identifier for the solar panel source.
- DC_POWER: Direct Current power generated by the solar panels (in kW).
- AC_POWER: Alternating Current power generated by the solar panels (in kW).
- DAILY_YIELD: The total amount of solar energy generated in a day (in kWh).
- TOTAL_YIELD: The cumulative total amount of solar energy generated (in kWh).
- AMBIENT_TEMPERATURE: The temperature of the surroundings (in Celsius).
- MODULE_TEMPERATURE: The temperature of the solar panels (in Celsius).
- IRRADIATION: The solar irradiance (in kW/m^2).
- DATE: The date of the data entry.
- TIME: The time of the data entry.
- DAY: The day of the month.
- MONTH: The month of the year.
- WEEK: The week of the year.
- HOURS: The hour of the day.
- MINUTES: The minute of the hour.
- TOTAL MINUTES PASS: The total minutes passed since the start of the day.
- DATE_STRING: A string representation of the date.
These features provide detailed information about the solar power generation, environmental conditions, and time-related attributes.
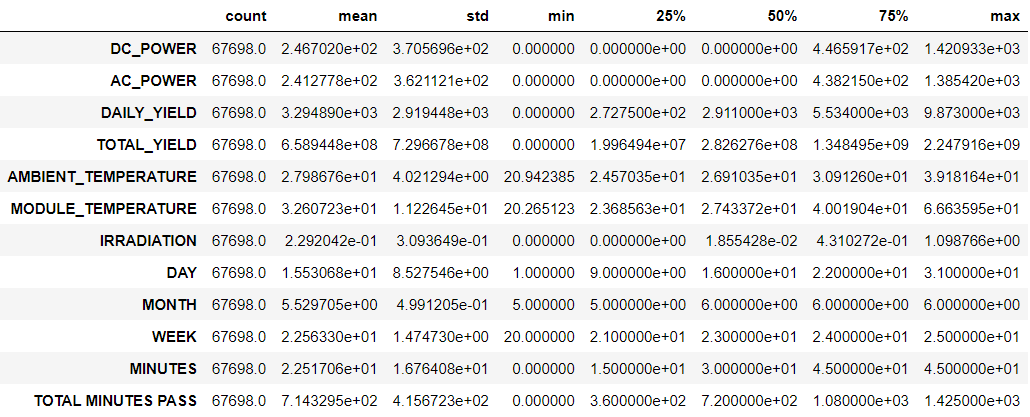
Examining summary statistics is beneficial because it provides a quick overview of key characteristics of the numerical data. The code below generates summary statistics for the numerical variables within the
dataset and transposes the result to display it in a more readable format.
These statistics include measures like mean (average), standard deviation (a measure of data spread), minimum, maximum, and quartiles. They help data analysts and scientists understand the central tendency, variability, and distribution of the data, which is crucial for making informed decisions about data preprocessing, feature selection, and modeling. Summary statistics also aid in identifying potential outliers or unusual patterns in the data.

Here’s what the .describe() method does:
- Count: Shows the number of non-missing entries in each column.
- Mean: Provides the average value for each column.
- Std (Standard Deviation): Indicates the amount of variation or dispersion in each column.
- Min: The smallest value in each column.
- 25% (First Quartile): The value below which 25% of the data falls.
- 50% (Median): The middle value of the dataset.
- 75% (Third Quartile): The value below which 75% of the data falls.
- Max: The largest value in each column.
Overview of dataset characteristics with the .describe() method:
Having showcased the value of summary statistics via the .describe() method for understanding the core trends and variations in our data, we now broaden our view by delving into metadata. This approach will further deepen our insight into the data’s framework and attributes (column names or features), enriching our comprehension of the dataset’s intricacies.
Metadata

Metadata provides an overview of the dataset itself; it’s the data about the data. It provides a high-level summary about the characteristics of the dataset. It includes details such as the column names, the types of data contained in each column (numerical, textual, etc.), and the count of non-null entries in each column, among other aspects. The code snippet below is typically utilized to retrieve the metadata of a dataset.

Upon executing the code, a succinct summary is displayed. This offers valuable insights into the various data types present and the memory usage in the dataset. This information is crucial for deeper analytical efforts. The output generated might begin as follows:

- Range Index: The dataset is indexed from 0 to 67697, providing a unique identifier for each row.
- Columns: There are a total of 18 columns, each representing a different feature or attribute related to solar power generation.
- Column Details: Each column’s non-null count is 67698, indicating no missing values in the dataset.
- Data Types: The dataset consists of datetime (datetime64[ns]), floating-point (float64), integer (int64), and object (string) data types.
- Memory Usage: The dataset consumes approximately 9.8 MB of memory.
One of the primary responsibilities of a data scientist or machine learning practitioner involves communicating findings to stakeholders. Therefore, an integral part of their role is to create visualizations that convey insights derived from data analysis. This visualizations ensure that information is accessible and understandable.
To illustrate this point, let’s take a look into a couple of visualizations:
Cumulative Daily Solar Power Yield Trend: The line plot presents the cumulative solar power yield. It aggregates the total amount of solar energy generated over a 100-day period. Each successive point on the line adds the yield of that day to the previous total, illustrating how much energy has been accumulated to date. Observing this plot allows us to discern patterns and trends. For example, increases on particularly sunny days or plateaus during periods of poor weather. It’s an effective way to visualize progress and the overall effectiveness of solar power generation over time.

Temperature Influence on Daily Solar Yield: The scatter plot below displays individual days as points plotted against two variables: the ambient temperature and the solar power yield for that day. By examining where points cluster, we can infer the relationship between warmer temperatures and energy output. For instance, a cluster of points at higher temperatures and higher yields might suggest a positive correlation, indicating that as temperatures rise, so does the solar power yield. This visualization helps in understanding how external environmental factors, such as temperature, may affect the efficiency of solar power generation.

Visualizations clarify complex information and support informed decision-making. Building on these insights, we now turn our attention to the process of feature engineering, where we refine and transform data to further enhance model performance.
Feature Engineering

In the realm of data analytics, for solar energy generation forecasting, a crucial preliminary step before training machine learning models is feature engineering. This process entails transforming the raw dataset into a format that’s more amenable to analysis by machine learning algorithms, enhancing their capability to deliver more accurate predictions for various aspects such as solar irradiance, power output, panel efficiency, and energy consumption through advanced forecasting techniques. Good feature engineering is a foundation for learning algorithms, transforming raw data into informative features that simplify the forecasting task and yield better results [5].
In feature engineering for datasets like the solar power generation dataset, several key actions are commonly considered, even if not specifically implemented in the given dataset. These actions can include the extraction of relevant attributes from the data, careful handling of any missing values to ensure the integrity of the dataset, and potentially encoding of categorical variables and normalization or scaling of numerical variables to prepare the data for machine learning models. Although the current dataset may not have undergone these specific transformations, they are standard practices in the process of making raw data more suitable for generating accurate machine learning predictions.
Furthermore, feature engineering may involve creating new features through methods like combining related attributes or decomposing existing ones into more granular components, as well as identifying the most impactful features that drive the accuracy of the model’s predictions. By meticulously refining and curating the dataset with these techniques, we can enhance the model’s ability to discern patterns and improve the precision of various solar power generation outcomes, such as optimizing energy output, managing resource allocation, and improving panel efficiency. Additionally, selecting the most relevant features can reduce model complexity and enhance performance. Now let’s delve into some key elements of feature engineering for solar power generation forecasting:
- Data Extraction and Refinement: Sifting through the df_solar dataset to isolate meaningful attributes, such as solar irradiance, panel temperature, AC/DC power output, and ambient temperature, and ensuring the dataset’s robustness with no missing records.
- Feature Transformation: Encoding categorical variables like panel IDs into a numerical format interpretable by machine learning models and normalizing numerical variables like irradiance, temperature, and power output to prevent any single feature from disproportionately influencing the prediction due to its scale.
- Feature Creation and Selection: Generating new features by aggregating similar data points or decomposing complex solar power generation attributes into simpler ones, and choosing the most relevant features that enhance the predictive precision of the forecasting model.
- Optimization for Predictive Accuracy: The overarching goal is to refine the dataset. Augmenting the model’s proficiency in recognizing patterns and determinants that affect solar power generation forecasting, thereby enhancing the reliability and utility of its predictions.
After having explored feature engineering, the next crucial stage is Model Training. This phase involves using the processed dataset, now optimized with carefully engineered features, to train the machine learning model on discerning the intricacies of various factors influencing solar power generation. With this foundational work in place, we are now ready to advance to the topic of training the model.
Training the Model
After preparing the dataset through feature engineering, the next stage is Model Training. In this phase, the machine “learns” to discern between various factors influencing solar power generation. These factors includes such as solar irradiance, panel efficiency, temperature conditions, and energy consumption. We divide the dataset into training and testing groups. A crucial step to ensure the model is trained on a specific subset of data while its performance is evaluated on another set of unseen data.
As emphasized earlier, this article does not aim to serve as an exhaustive tutorial on machine learning. Rather, its purpose is to showcase how machine learning techniques can be applied, analyzed & optimized various aspects of solar power generation forecasting.
The following code snippets are designed to lay the groundwork for the various steps involved in training a model for solar power generation forecasting. Although the details may not form a complete program, they offer a glimpse into the type of approach needed to build & train a model for analyzing solar power generation forecasting.


Moving forward, we’ll explore the Model Interpretation phase, focusing on how our model predicts various aspects of solar power generation. Here, the emphasis isn’t on the complexity of the model but on its accuracy and reliability. It’s crucial to understand that the model does more than just churn out predictions. It provides insights into solar energy patterns and trends, translating raw data into actionable intelligence. In simpler terms, the goal is to assess if the model is effective, to understand the mechanics behind its predictions, and the reasons we can trust its guidance. This comprehension is key to confidently relying on the model for strategic decision-making processes for solar generation.
Model Interpretation

In the context of solar power generation forecasting using machine learning, model interpretation is centered around understanding how algorithms analyze solar energy data such as irradiance, panel temperature, and weather conditions to optimize energy production. This phase is crucial for ensuring that the insights provided by the model are accurate, explainable, and actionable. Explainability adds value even when regulators or customers don’t explicitly require it. It fosters a level of transparency that builds trust with stakeholders [6, 7]. Emphasizing explainability is a critical component of ethical ML practices, underscoring its importance in development and deployment of predictive models for solar energy.
Interpreting these “black box” models can be challenging, as it requires simplifying complex algorithms without losing essential details. It extends beyond mere prediction accuracy. It involves unraveling the factors that influence solar power output and identifying trends that might not be immediately apparent. For example, understanding how a change in panel temperature or irradiance impacts energy production can offer insights for improving solar panel efficiency and optimizing resource management.
Evaluating model performance involves analyzing key metrics to assess the effectiveness of the solar power generation prediction system. Model evaluation plays a pivotal role in this process. It offers quantitative measure of the model’s predictive capabilities in the context of solar energy.
- Mean Absolute Error (MAE): Measures the average magnitude of the errors in a set of predictions. It provides an indication of how close the forecasts are to the actual observations in terms of solar power output.
- Root Mean Squared Error (RMSE): Measures the square root of the average of the squared differences between predicted and actual values, giving a higher weight to larger errors in solar power predictions.
Situational Metrics:
- Economic Metrics: These metrics evaluate the impact of the model’s recommendations on economic outcomes, such as energy cost savings, return on investment, and other business-driven metrics. They assess the practical value of the model beyond scientific accuracy.
- Time-based Metrics: These metrics assess the operational efficiency of the model, including its runtime and the frequency of retraining required. They are particularly important in solar power generation, where timely decision-making is critical.
These metrics, alongside advanced interpretability and explainability techniques such as feature importance rankings and partial dependence plots, aid in demystifying the model’s decision-making process. They allow energy managers and solar power operators to refine energy production strategies, optimize prediction accuracy, and enhance the understanding of complex solar power systems.
Key Takeaways
This article explores the pivotal role of machine learning in revolutionizing solar power generation forecasting, underscoring the advancements in predicting solar energy output and optimizing renewable energy resources. By examining the process of analyzing diverse solar power data, such as solar irradiance, panel temperature, and energy consumption, it highlights how machine learning algorithms are harnessed to enhance the accuracy of power generation predictions. The discussion spans feature engineering, model training, and interpretation, providing a deep dive into technical methodologies that bolster predictive performance. Through code examples, the article demonstrates the real-world application of these techniques in optimizing solar energy strategies & resource management. Ultimately, the article accentuates the significance of machine learning in transforming solar power generation. We encourage readers to further explore the intersection of data science & renewable energy, with a focus on solar power forecasting.
Next Steps
- Technology-related roles are the fastest growing jobs in percentage terms, including Big Data Specialists, AI & Machine Learning Specialists & Developers [8]. This insight from the World Economic Forum’s 2025 report highlights the growing demand in these fields. To position yourself advantageously in the job market, consider WeCloudData’s bootcamps. If you want to become a machine learning engineer, consider joining WeCloudData’s AI and Machine Learning bootcamp. Earn your Machine learning Certificate today! With real client projects, 1-on-1 mentorship, and hands-on experience in Weclouddata’s programs, it’s an opportunity to develop expertise in AI & Machine learning. Align your skills with the current and future needs of the job market. Set yourself up for success in a dynamic and rewarding career; take action now!
- WeCloudData not only offers short courses but also provides a comprehensive range of resources to support your learning journey. These include live public training sessions led by industry experts, career workshops to prepare you for the job market, dedicated career services, and portfolio support to help showcase your skills to potential employers.
References
[1] McKinsey & Company. The power industry’s shift to sustainable energy. Retrieved from https://www.mckinsey.com/industries/electric-power-and-natural-gas/our-insights/the-power-industrys-shift-to-sustainable-energy
[2] McKinsey & Company. Energy 2050: Insights from the ground up. Retrieved from https://www.mckinsey.com/industries/electric-power-and-natural-gas/our-insights/energy-2050-insights-from-the-ground-up
[3] McKinsey & Company. Global Energy Perspective 2023: Power outlook. Retrieved from https://www.mckinsey.com/industries/oil-and-gas/our-insights/global-energy-perspective
[4] Sarmas, E., Dimitropoulos, N., Marinakis, V., Mylona, Z., & Doukas, H. (2022). Transfer Learning Strategies for Solar Power Forecasting Under Data Scarcity. Scientific Reports, 12(1), 14643. Retrieved from https://www.nature.com/articles/s41598-022-18516-x
[5] Rawat, T., & Khemchandani, V. (2019). Feature Engineering (FE) Tools and Techniques for Better Classification Performance. International Journal of Innovations in Engineering and Technology, 8(2). DOI: 10.21172/ijiet.82.024.
[6] Rawat, T., & Khemchandani, V. (2019). Feature Engineering (FE) Tools and Techniques for Better Classification Performance. International Journal of Innovations in Engineering and Technology, 8(2). DOI: 10.21172/ijiet.82.024. Retrieved from https://www.researchgate.net/publication/333015077_Feature_Engineering_FE_Tools_and_Techniques_for_Better_Classification_Performance
[7] Molnar, C. (2020). Interpretable Machine Learning. Retrieved from https://christophm.github.io/interpretable-ml-book/.
[8] World Economic Forum (2025). “Future of Jobs Report 2025.” Retrieved from https://reports.weforum.org/docs/WEF_Future_of_Jobs_Report_2025.pdf.
