The blog is posted by WeCloudData’s Data Engineering course student Rupal Bhatt.
Here is a Donut Chart prepared from processed data. Our data passes through several processes before meeting a dashboard and giving us a full picture like the one above.
This is an attempt to show you one way of processing such data.
Big data pipelines is an overwhelming subject for a new comer in the field. There are several technologies and languages to choose from. There are several different ways of doing one simple (or complicated) job.
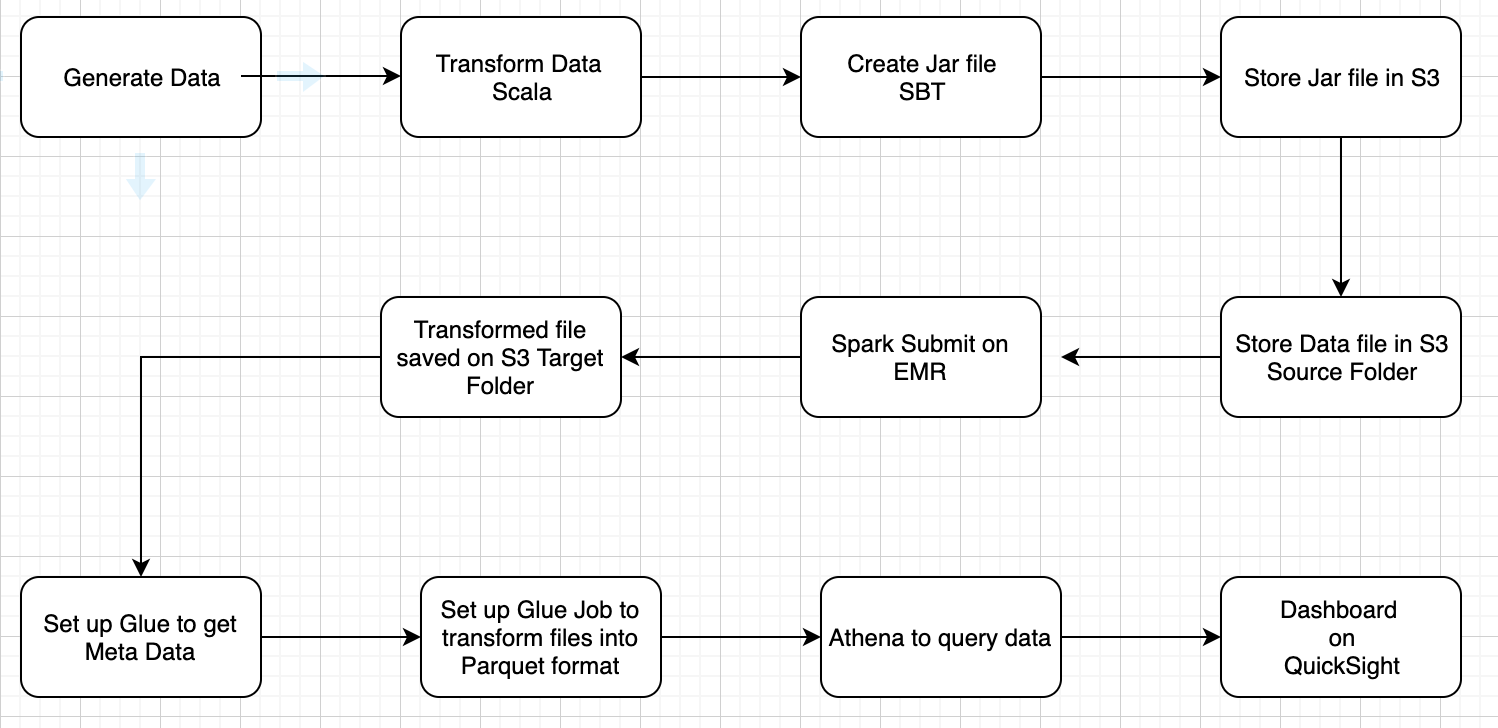
Here is an overview of a simple example of a data pipeline of building retail data pipeline. This job can be done differently and efficiently using Apache AirFlow but we will leave that for another time. Here we are using Scala, Spark on EMR cluster, Glue, Athena and QuickSight.
Following are the steps:
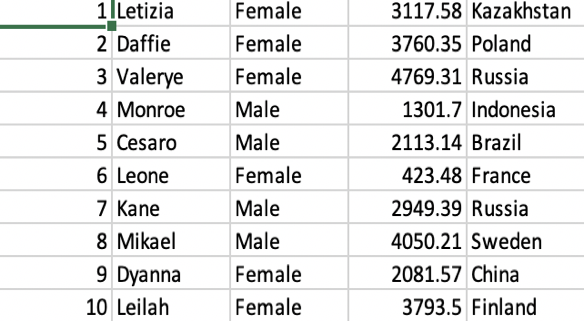
Generating rough data from an online Data generator:
This dataset is generated using a data generator to represent some fictitious purchase data from various countries in the world. Here we have purchases made by individual consumers. Such fictitious data can be regenerated every time you decide to test and retest your pipeline. I have used mockaroo.com to generate this very simple dataset.
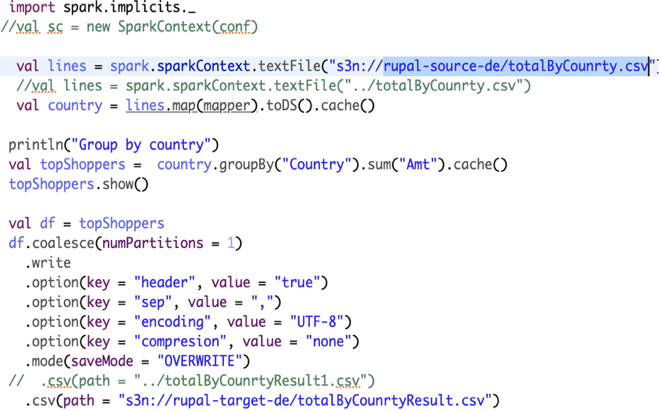
Use Scala to get Total Amount Spent by country:
The next important step is to keep the code ready to process the data that we have generated. Which language we use to process data is one important decision we make at this step. Scala uses Java Virtual Machine (JVM) that makes it 10 times faster than Python. However, it is a bit harder than Python to master and that is why we have kept this example very simple. All we do here is get the file from S3 or local drive and group by country and sum the amount of purchase.
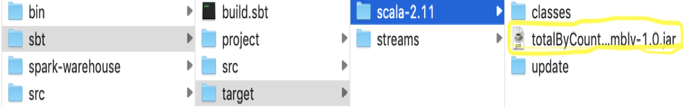
Create Jar File using SBT:
A jar file is a package of java class files, associated meta data and resources into one file for distribution. We will be using Jar File to run our program on an EMR cluster.
SBT : No, it doesn’t mean “Sad But True” and it doesn’t mean “Sorry ‘Bout That” — it really means Simple Build Tool. We are using SBT software here to create the Jar File. We need to test, run and rerun our code several times and it is not easy to do this manually every time. Build tools are a way to automating all such processes. You need to have a specific file structure for SBT as you can see it below.
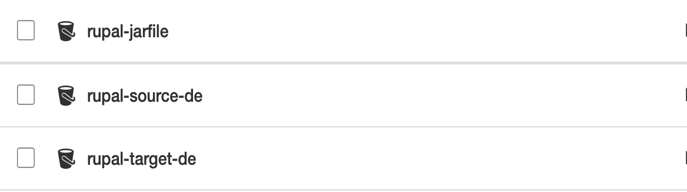
Set up S3 environment:
We need to have the following buckets in S3 — the names explain the purpose of each one, isn’t it?
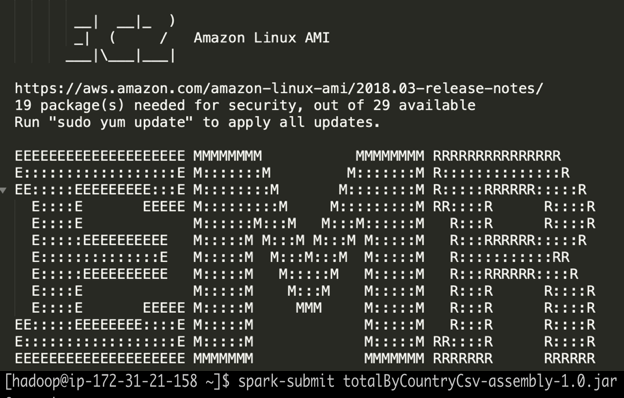
Set up EMR and Spark Submit Jar file on EMR cluster on AWS:
Log into AWS and set up EMR cluster and run the jar file.
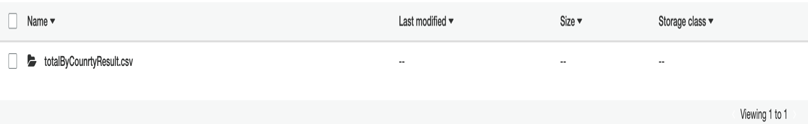
The transformed file will be stored in the S3 Target bucket.
Once we run SparkSubmit command on EMR we have the CSV file created from the transformation process. It is saved on S3 Target bucket, as you see it below.
AWS Glue:
We use AWS Glue for this project. Glue is a fully managed, pay-as-you-go ETL (Extract, Transform and Load) service. It makes it easier for us to extract data for analytics.
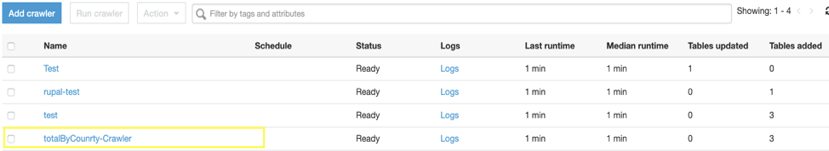
Glue Crawler: The crawler populates Glue Data Catalog with tables. It can crawl multiple data stores and creates or updates table metadata in Data Catalog. Here we have a crawler to get metadata of ‘totalByCountryResult.csv’ file.
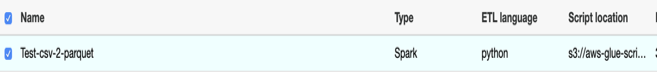
Glue Job: Create parquet format in Glue
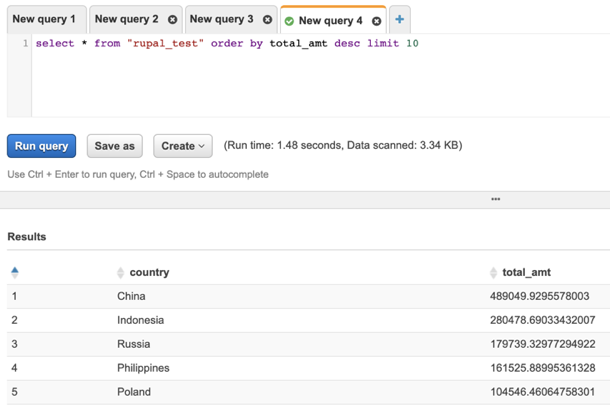
Query Final Results in Athena:
AWS Athena is an interactive query service to analyze data that is stored in S3 bucket. With Athena we can use standard SQL to query data. Athena is server less so there is no infrastructure to manage, and once again just like AWS Glue, AWS Athena also is pay-as-you-go service so you pay only for the queries you run.
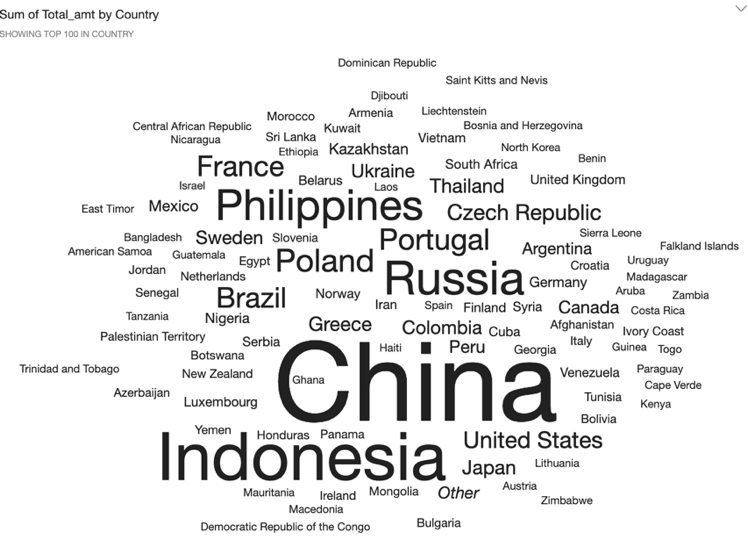
Prepare Dashboard of the findings with QuickSight:
AWS QuickSight is a fast, cloud-powered business intelligence service that makes it easy to deliver insights in the form of a dashboard.
As you notice, here we have transformed individual purchases into a country-wise trend. It is clear from the WordCloud prepared in QuickSight.
This pipeline can be created with different tools like AirFlow instead of Glue, Python instead of Scala, and Tableau instead of QuickSight. Thus this concludes our building retail data pipeline for now.
To find out more about the courses our students have taken to complete these projects and what you can learn from WeCloudData, click here to see the learning path. To read more posts from Rupal, check out her Medium posts here.
