Picture this: You’re planning a picnic with friends, and the weather forecast predicts a sunny day. But just as you lay out your blanket, dark clouds gather, and rain pours down, ruining your plans. Sounds familiar? This scenario aptly underscores the challenges of traditional weather forecasting. However, machine learning is revolutionizing this field, making weather predictions more accurate and reliable than ever before.
Weather forecasting is a complex science that involves analyzing vast amounts of data from various sources, including satellites, weather stations, and radar systems. While traditional methods often struggle to process and interpret this data quickly and accurately, machine learning models excel at handling large datasets and identifying patterns within them. By leveraging machine learning algorithms, meteorologists can now process real-time data more efficiently, improving the accuracy of weather predictions [1].
The integration of machine learning in weather forecasting has led to the development of more sophisticated models that can handle the complexity and variability of atmospheric data. These models can learn from historical weather patterns and improve their predictive capabilities over time. As a result, forecasts are becoming more precise, providing valuable insights for various sectors such as agriculture, & emergency management. The ongoing advancements in machine learning algorithms and computational power are expected to further enhance the accuracy and timeliness of weather predictions. Ultimately leading to more informed decision-making and better preparedness for weather-related events [2].
The application of machine learning in weather forecasting extends beyond improving prediction accuracy. It also offers a paradigm shift in the approach to forecasting, moving from traditional deductive reasoning to inductive reasoning. This shift enables forecasters to uncover patterns and relationships in the data that were previously unattainable. Hence opening up new possibilities for predicting weather phenomena. Furthermore, machine learning models provide the flexibility to adapt to new data and uncover non-linear relationships. These makes them invaluable tools in the ever-evolving field of meteorology. As these models continue to evolve, they hold the promise of transforming our understanding and prediction of weather patterns. In particular leading to more resilient and informed responses to climate variability and change [3].
However, the operational integration of machine learning for weather forecasting presents its own set of challenges. In particular, in ensuring the continuous, reliable, and efficient deployment of machine-learning models. Machine Learning Operations (MLOps) is emerging as a crucial framework for addressing these challenges, enabling meteorologists to maintain and update models. The experiences of MeteoSwiss in implementing MLOps for postprocessing numerical weather prediction surface wind forecasts highlight the potential for machine learning to not only enhance forecast accuracy but also streamline the operational workflow (MeteoSwiss is the Federal Office of Meteorology and Climatology in Switzerland. It is responsible for providing weather and climate services for the protection and benefit of Switzerland). This development points towards a future where machine learning is seamlessly woven into the fabric of meteorological operations. In turn, further elevating the precision and responsiveness of weather forecasting systems [4].
Please note that the aim of this article is to showcase the practical utility of machine learning in enriching our everyday lives, rather than to explore its technical complexities. We aim to highlight the fascinating applications of machine learning in weather forecasting, with an aim of sparking an interest that encourages further exploration into data science and machine learning.
That being said, let’s take a look at some code snippets to see machine learning in action for weather forecasting.
The code snippets in this article are sourced from a Kaggle notebook by Mateuszk, titled “Forecasting Weather Patterns Using ARIMA & RNN”. Kaggle is a platform that provides a community for data scientists and machine learning practitioners to explore, analyze, and share quality data sets and build machine learning models. Moreover, it offers a collaborative environment where users can participate in competitions, access a broad range of datasets, and gain insights from other professionals in the field.
Continuing from our previous discussion on Kaggle, this code snippet below sets up the foundation for a machine learning project focused on weather forecasting. It includes importing essential libraries, such as numpy and pandas for data manipulation. This setup is crucial for exploring, cleaning, and understanding data before applying any machine learning models, making it a foundational step in any data science project.

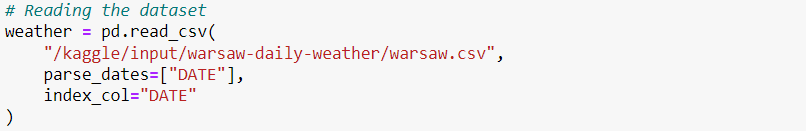
The code below loads a datasets named ‘warsaw.csv’ from a specified path on Kaggle into a Pandas DataFrame, which is a structure used for data manipulation in Python. It instructs Pandas to parse the “DATE” column as dates, and sets this column as the index for the resulting DataFrame. This is typical for data analysis tasks involving time series data, as it allows for easier manipulation and querying of the data based on dates.
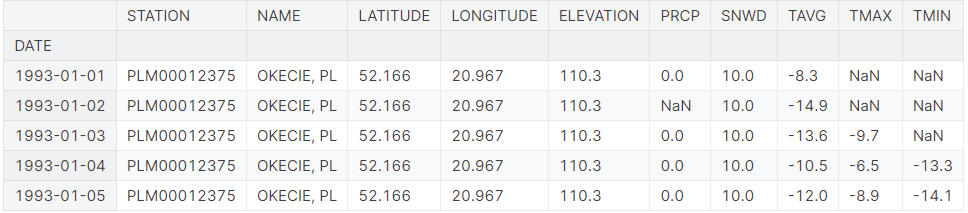
The .head() function is used to display the first five rows of this dataset.

Warsaw dataset overview – top five rows:
The dataset contain the following features (also referred to as attributes or column names):
- STATION: The station identifier.
- NAME: The name of the station.
- LATITUDE: The latitude of the station.
- LONGITUDE: The longitude of the station.
- ELEVATION: The elevation of the station in meters.
- DATE: The date of the observation.
- PRCP: Precipitation in millimeters.
- SNWD: Snow depth in millimeters.
- TAVG: Average temperature in degrees Celsius.
- TMAX: Maximum temperature in degrees Celsius.
- TMIN: Minimum temperature in degrees Celsius.
This description provides a foundational understanding of how the the data is structured.
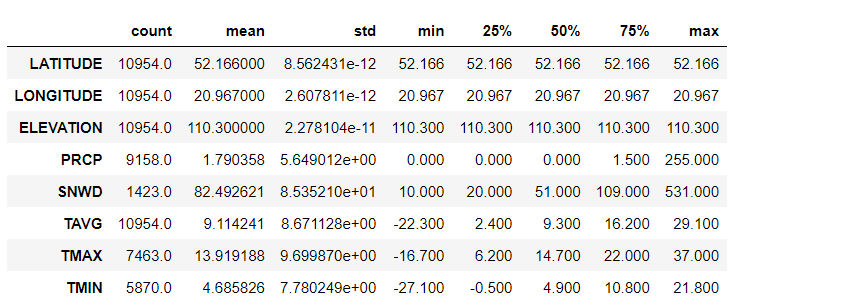
Examining summary statistics is beneficial because it provides a quick overview of key characteristics of the numerical data. The code below generates summary statistics for the numerical variables within the dataset and transposes the result to display it in a more readable format.
These statistics include measures like mean (average), standard deviation (a measure of data spread), minimum, maximum, and quartiles. They help data analysts and scientists understand the central tendency, variability, and distribution of the data. This helps in making informed decisions about data preprocessing, feature selection, and modeling. Summary statistics also aid in identifying potential outliers or unusual patterns in the data.

Here’s what the .describe() method does:
- Count: Shows the number of non-missing entries in each column.
- Mean: Provides the average value for each column.
- Std (Standard Deviation): Indicates the amount of variation or dispersion in each column.
- Min: The smallest value in each column.
- 25% (First Quartile): The value below which 25% of the data falls.
- 50% (Median): The middle value of the dataset.
- 75% (Third Quartile): The value below which 75% of the data falls.
- Max: The largest value in each column.
Overview of dataset characteristics with the .describe() method:
Having showcased the value of summary statistics via the .describe() method for understanding the core trends and variations in our data, we now broaden our view by delving into metadata. This approach will further deepen our insight into the data’s framework and attributes (column names or features), enriching our comprehension of the dataset’s intricacies.
Metadata

Metadata provides an overview of the dataset itself. It’s the data about the data. It provides a high-level summary about the characteristics of the dataset. It includes details such as the column names, the types of data contained in each column (numerical, textual, etc.), and the count of non-null entries in each column, among other aspects. The code snippet below is typically utilized to retrieve the metadata of a dataset.

Upon executing the code, a succinct summary is displayed. It offers valuable insights into the various data types present and the memory usage in the dataset. This information is crucial for deeper analytical efforts. The output generated might begin as follows:
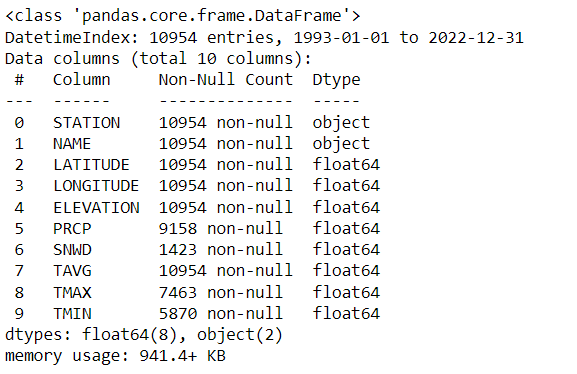
- Range Index: The dataset is indexed from 0 to 10953, providing a unique identifier for each row.
- Columns: There are a total of 10 columns, each representing a different feature or attribute related to weather observations.
- Column Details: Each column’s non-null count varies, with some columns having fewer non-null counts than others.
- Data Types: The dataset primarily consists of floating-point (float64) and the rest having an object (string) data type.
- Memory Usage: The dataset consumes approximately 942 KB of memory.
One of the primary responsibilities of a data scientist or machine learning practitioner involves communicating findings to stakeholders. Therefore, an integral part of their role is to create visualizations that convey insights derived from data analysis. Data visualization ensures that the information is accessible and understandable.
To illustrate this point, let’s take a look into a couple of visualizations.
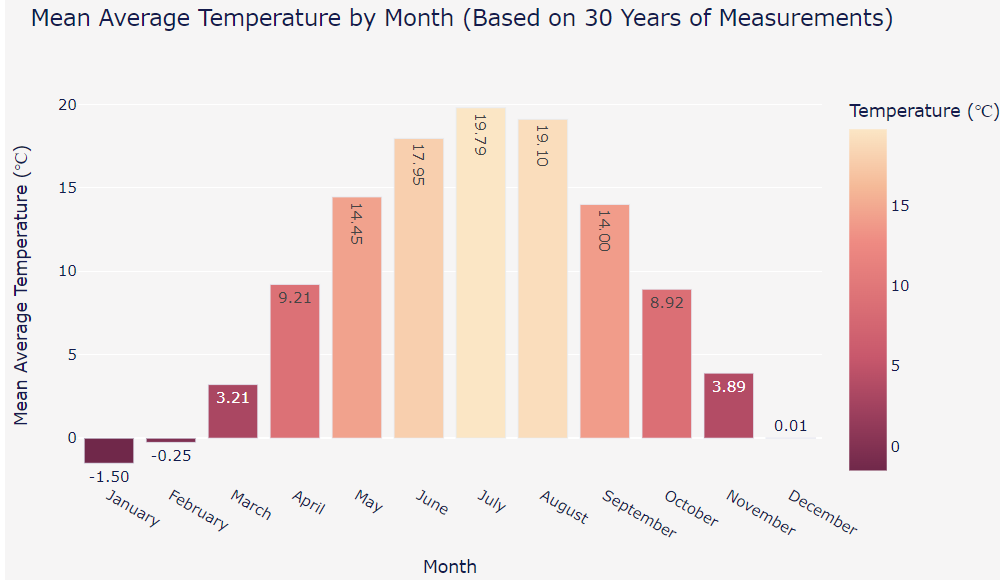
Monthly Temperature Variations: The bar chart below illustrates the average monthly temperatures based on 30 years of data collected from Warsaw, Poland. The temperatures range from the coldest month, January, with an average of -1.50°C, to warmest month, July, with an average of 19.21°C. There is a noticeable trend of rising temperatures from January to July, followed by a decrease towards December. This visual suggests that the climate experiences a wide range of temperatures throughout the year. It shows significant warming in the summer months and cooling in the winter months.
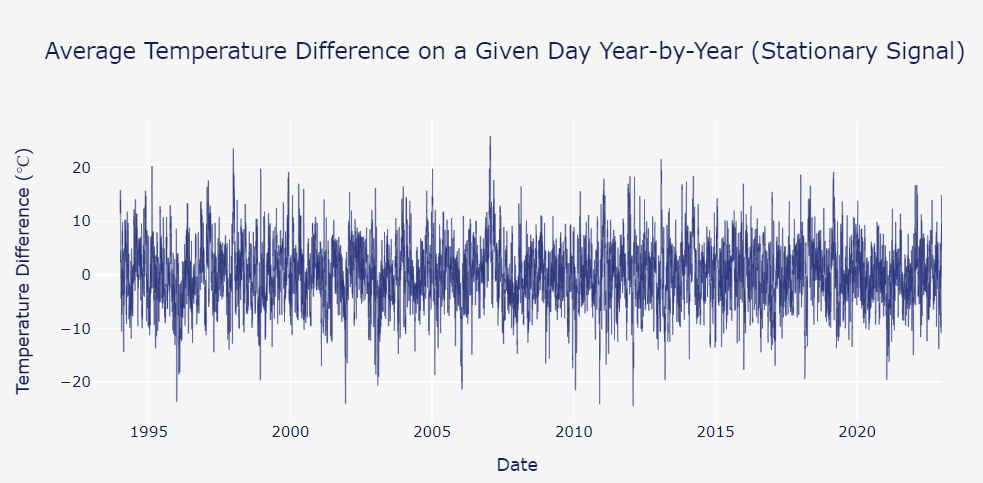
Yearly Temperature Fluctuations: The time series plot depicted below demonstrates the variability in average temperature differences from a fixed point in time, measured in Warsaw, Poland, across various years (from circa 1995 to 2020). The data points oscillate significantly, indicating day-to-day temperature fluctuations within each year. The range of these differences spans from below -20°C to above 20°C. Despite the apparent volatility, there’s no clear long-term trend visible, which suggests a stationary signal over the 25-year period. This implies that while daily temperatures vary, the overall climate remains consistent year over year.
Visualizations clarify complex information and support informed decision-making. Building on these insights, we now turn our attention to the process of feature engineering. In feature engineering, we refine and transform data to further enhance model performance.
Feature Engineering

In the realm of data analytics for predictive modeling, a crucial preliminary step before training machine learning models is feature engineering. This process entails transforming the raw dataset into a format that’s more amenable to analysis by machine learning algorithms. So to enhance their capability to deliver more accurate predictive weather analytics for your day through advanced weather forecasting.
In feature engineering for datasets like the Warsaw weather dataset, several key actions are commonly considered, even if not specifically implemented in the given dataset. These actions can include the extraction of relevant attributes from the data, careful handling of any missing values to ensure the integrity of the dataset, and potentially encoding of categorical variables and normalization or scaling of numerical variables to prepare the data for machine learning models. Although the current dataset may not have undergone these specific transformations yet, they are standard practices in the process of making raw data more suitable for generating accurate machine learning predictions.
Furthermore, feature engineering may involve creating new features through methods like combining related attributes or decomposing existing ones into more granular components, as well as identifying the most impactful features that drive the accuracy of the model’s predictions. By refining and curating the dataset with these techniques, we can significantly enhance the model’s ability to discern patterns and improve the precision of weather forecasts. Additionally, selecting the most relevant features can reduce model complexity and enhance performance. Now let’s delve into some key elements of feature engineering:
- Data Extraction and Refinement: Sifting through weather data to isolate meaningful attributes and carefully managing any incomplete records to ensure the robustness of the dataset.
- Feature Transformation: Encoding categorical meteorological events into a numerical format interpretable by machine learning models and normalizing numerical variables like temperature and precipitation measurements to prevent any single feature from disproportionately influencing the prediction due to its scale.
- Feature Creation and Selection: Generating new features by aggregating similar data points or decomposing complex meteorological attributes into simpler ones, and choosing the most relevant features that enhance the predictive precision of the weather forecasting model.
- Optimization for Predictive Accuracy: The overarching goal is to refine the dataset. Refining the model’s proficiency in recognizing weather patterns and determinants that affect forecasting accuracy, thereby enhancing the reliability and utility of its predictions.
After having explored feature engineering, the next crucial stage is Model Training. This phase involves using the processed dataset, now optimized with carefully engineered features. So it helps in training the machine learning model on discerning the intricacies of weather patterns. With this foundational work in place, we are ready to advance to the topic of training the model.
Training the Model

In this phase, the machine “learns” to distinguish between user preferences and behaviors. This indicate a likelihood of enjoying a particular movie and those that do not. The machine “learns” to discern between weather patterns and factors that indicate a likelihood of certain weather conditions. The dataset is divided into training and testing groups. After all, a crucial step to ensure the model is trained on a specific subset of data while its performance is evaluated on another set of unseen data.
As emphasized earlier, this article does not aim to serve as an exhaustive tutorial on machine learning. Rather, its purpose is to showcase how machine learning techniques can be applied to analyze and predict weather conditions.
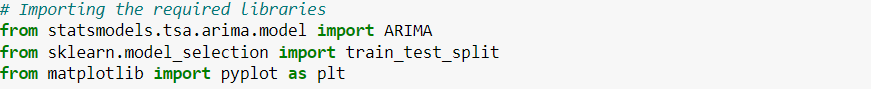
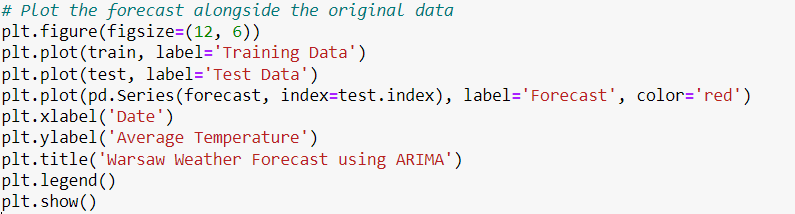
The following code snippets are designed to lay the groundwork for the various steps involved in training a model for weather forecasting. While the details may not constitute a complete program, they provide a glimpse into the type of approach required to build and train a model tailored for analyzing weather patterns and predicting forecasts.


Moving forward, we’ll explore the Model Interpretation phase, focusing on how our model predicts weather conditions. Here, the emphasis isn’t on the complexity of the model but on its accuracy and reliability. It’s crucial to understand that the model does more than just churn out predictions. It provides insights into weather patterns and trends, translating raw data into actionable intelligence. In simpler terms, the goal is not only to assess if the model is effective but to understand the mechanics behind its predictions and the reasons we can trust its guidance. This comprehension is key to confidently relying on the model for strategic decision-making processes in weather forecasting and climate analysis.
Model Interpretation

In the context of weather prediction using machine learning, model interpretation is centered around understanding how algorithms analyze meteorological data such as temperature, humidity, and pressure to distinguish between different weather patterns. This phase is crucial for ensuring that the insights provided by the model. These insights should not only be accurate but also meaningful, explainable, and actionable. Explainability is valuable even when it’s not explicitly demanded by regulators or customers. After all it fosters a level of transparency that builds trust with stakeholders [5, 6]. Emphasizing explainability is a critical component of ethical machine learning practices, underscoring its importance in the development and deployment of predictive models.
Interpreting these “black box” models can be challenging, as it requires simplifying complex algorithms without losing essential details. It extends beyond mere prediction accuracy. It involves unraveling the factors that influence weather patterns and identifying trends that might not be immediately apparent. For example, understanding how a change in pressure systems or humidity levels impacts the likelihood of precipitation can offer valuable insights for improving weather forecasts and optimizing decision-making processes.
Evaluating model performance involves analyzing key metrics to assess the effectiveness of the forecasting system. Model evaluation plays a pivotal role in this process, offering a quantitative measure of the model’s predictive capabilities:
- Mean Absolute Error (MAE): Measures the average magnitude of the errors in a set of predictions, providing an indication of how close the forecasts are to the actual observations.
- Root Mean Squared Error (RMSE): Measures the square root of the average of the squared differences between predicted and actual values, giving a higher weight to larger errors.
- Coverage: Measures the percentage of the weather phenomena that the forecasting system is able to predict, indicating the system’s ability to provide comprehensive forecasts.
- Skill Score: Measures the improvement of the forecast model over a reference model, such as climatology or persistence, indicating the added value of the model.
These metrics, alongside advanced interpretability and explainability techniques such as feature importance rankings and partial dependence plots, aid in demystifying the model’s decision-making process. They allow meteorologists and climate scientists to refine forecasting strategies, optimize prediction accuracy, and enhance the understanding of complex weather systems.
In conclusion, the integration of model interpretation into the analytics process for weather forecasting is essential. It transforms predictive modeling from a mere computational task into a strategic asset that aids decision-making. By employing a holistic approach that combines actionable insights with rigorous performance metrics, meteorologists can align their strategies with data-driven intelligence. This improves forecast accuracy, optimizing resource allocation, and driving significant value in the field of meteorology and climate science.
Key Takeaways
This article explores the transformative role of machine learning in weather forecasting, highlighting the advancements in predicting weather patterns with greater accuracy. By examining the process of analyzing meteorological data, such as temperature, humidity, and pressure, it sheds light on how machine learning algorithms are employed to enhance forecast precision. The discussion encompasses feature engineering, model training, and interpretation, offering insights into the technical methodologies that improve predictive performance. Practical code examples in the field demonstrate the real-world application of these techniques. Ultimately, the article emphasizes the importance of machine learning in revolutionizing weather forecasting. It aims to encourages readers to further explore the intersection of data science and meteorology.
Next Steps
- Technology-related roles are the fastest growing jobs in percentage terms, including Big Data Specialists, Fintech Engineers, AI and Machine Learning Specialists and Software and Application Developers [7]. This insight from the World Economic Forum’s 2025 report highlights the growing demand in these fields. To position yourself advantageously in the job market, consider WeCloudData’s bootcamps. If you are interested in learning and becoming a machine learning engineer specialist, do check Weclouddata’s AI and Machine Learning bootcamp. Earn your Machine learning Certificate today! . With real client projects, one-on-one mentorship, and hands-on experience in our immersive programs. It’s an opportunity to develop expertise in AI and machine learning, aligning your skills with the current and future needs of the job market. Set yourself up for success in a dynamic and rewarding career; take action now!
References
[1] European Centre for Medium-Range Weather Forecasts (ECMWF). (2023). How AI models are transforming weather forecasting: a showcase of data-driven systems. Retrieved from https://www.ecmwf.int/en/about/media-centre/news/2023/how-ai-models-are-transforming-weather-forecasting-showcase-data.
[2] Schultz, D. M., Betancourt, C., & Charlesworth, L. J. (2021). Can deep learning beat numerical weather prediction? Philosophical Transactions of the Royal Society A: Mathematical, Physical and Engineering Sciences, 379(2194), 20200097.
[3] Climate.ai. (n.d.). Machine Learning Forecasting: How AI is Improving Weather Forecasting. Retrieved from https://climate.ai/blog/machine-learning-forecasting-how-ai-is-improving-weather-forecasting/.
[4] Nerini, D., Aznar, G., & Bhend, J. (2022). Machine Learning Operations for Weather Applications. Retrieved from https://meetingorganizer.copernicus.org/EMS2022/EMS2022-211.html.
[5] Molnar, C. (2020). Interpretable Machine Learning. Retrieved from https://christophm.github.io/interpretable-ml-book/.
[6] Doshi-Velez, F., & Kim, B. (2017). Towards A Rigorous Science of Interpretable Machine Learning. arXiv:1702.08608. Retrieved from https://arxiv.org/abs/1702.08608.
[7] World Economic Forum (2025). “Future of Jobs Report 2025.” Retrieved from https://reports.weforum.org/docs/WEF_Future_of_Jobs_Report_2025.pdf..
