LEARNING TRACK

Data Analytics Track

Intermediate
Online
Self-paced

Master the tools of modern analytics — from Excel and Tableau to SQL, Python, and AI. Build real-world projects that transform data into decisions and prepare for the future of intelligent business.

About the Track

The Data Analytics Track provides participants with a comprehensive foundation in data analysis, visualization, and reporting. The program begins with Excel and progresses through data visualization using leading tools such as Tableau and Power BI, before advancing to core technical skills in SQL and Python programming. Through hands-on training, participants gain the expertise to extract valuable insights, build dynamic dashboards, and support data-driven decision-making.

The track includes advanced training in predictive analytics, beginning with an introduction to generative AI and followed by AI automation. This ensures participants are equipped to meet the evolving demands of the data analytics field and stay ahead in an increasingly intelligent digital landscape. The program concludes with a series of capstone projects based on real-world industry use cases, allowing participants to apply their skills.

Top data skills program voted by students and partners

Courses in this track

Intermediate

By the end of this course, participants will be able to:

  • Understand the role of data and business intelligence (BI) analysts
  • Identify key stages in the data analytics learning path
  • Recognize core concepts in data and business intelligence
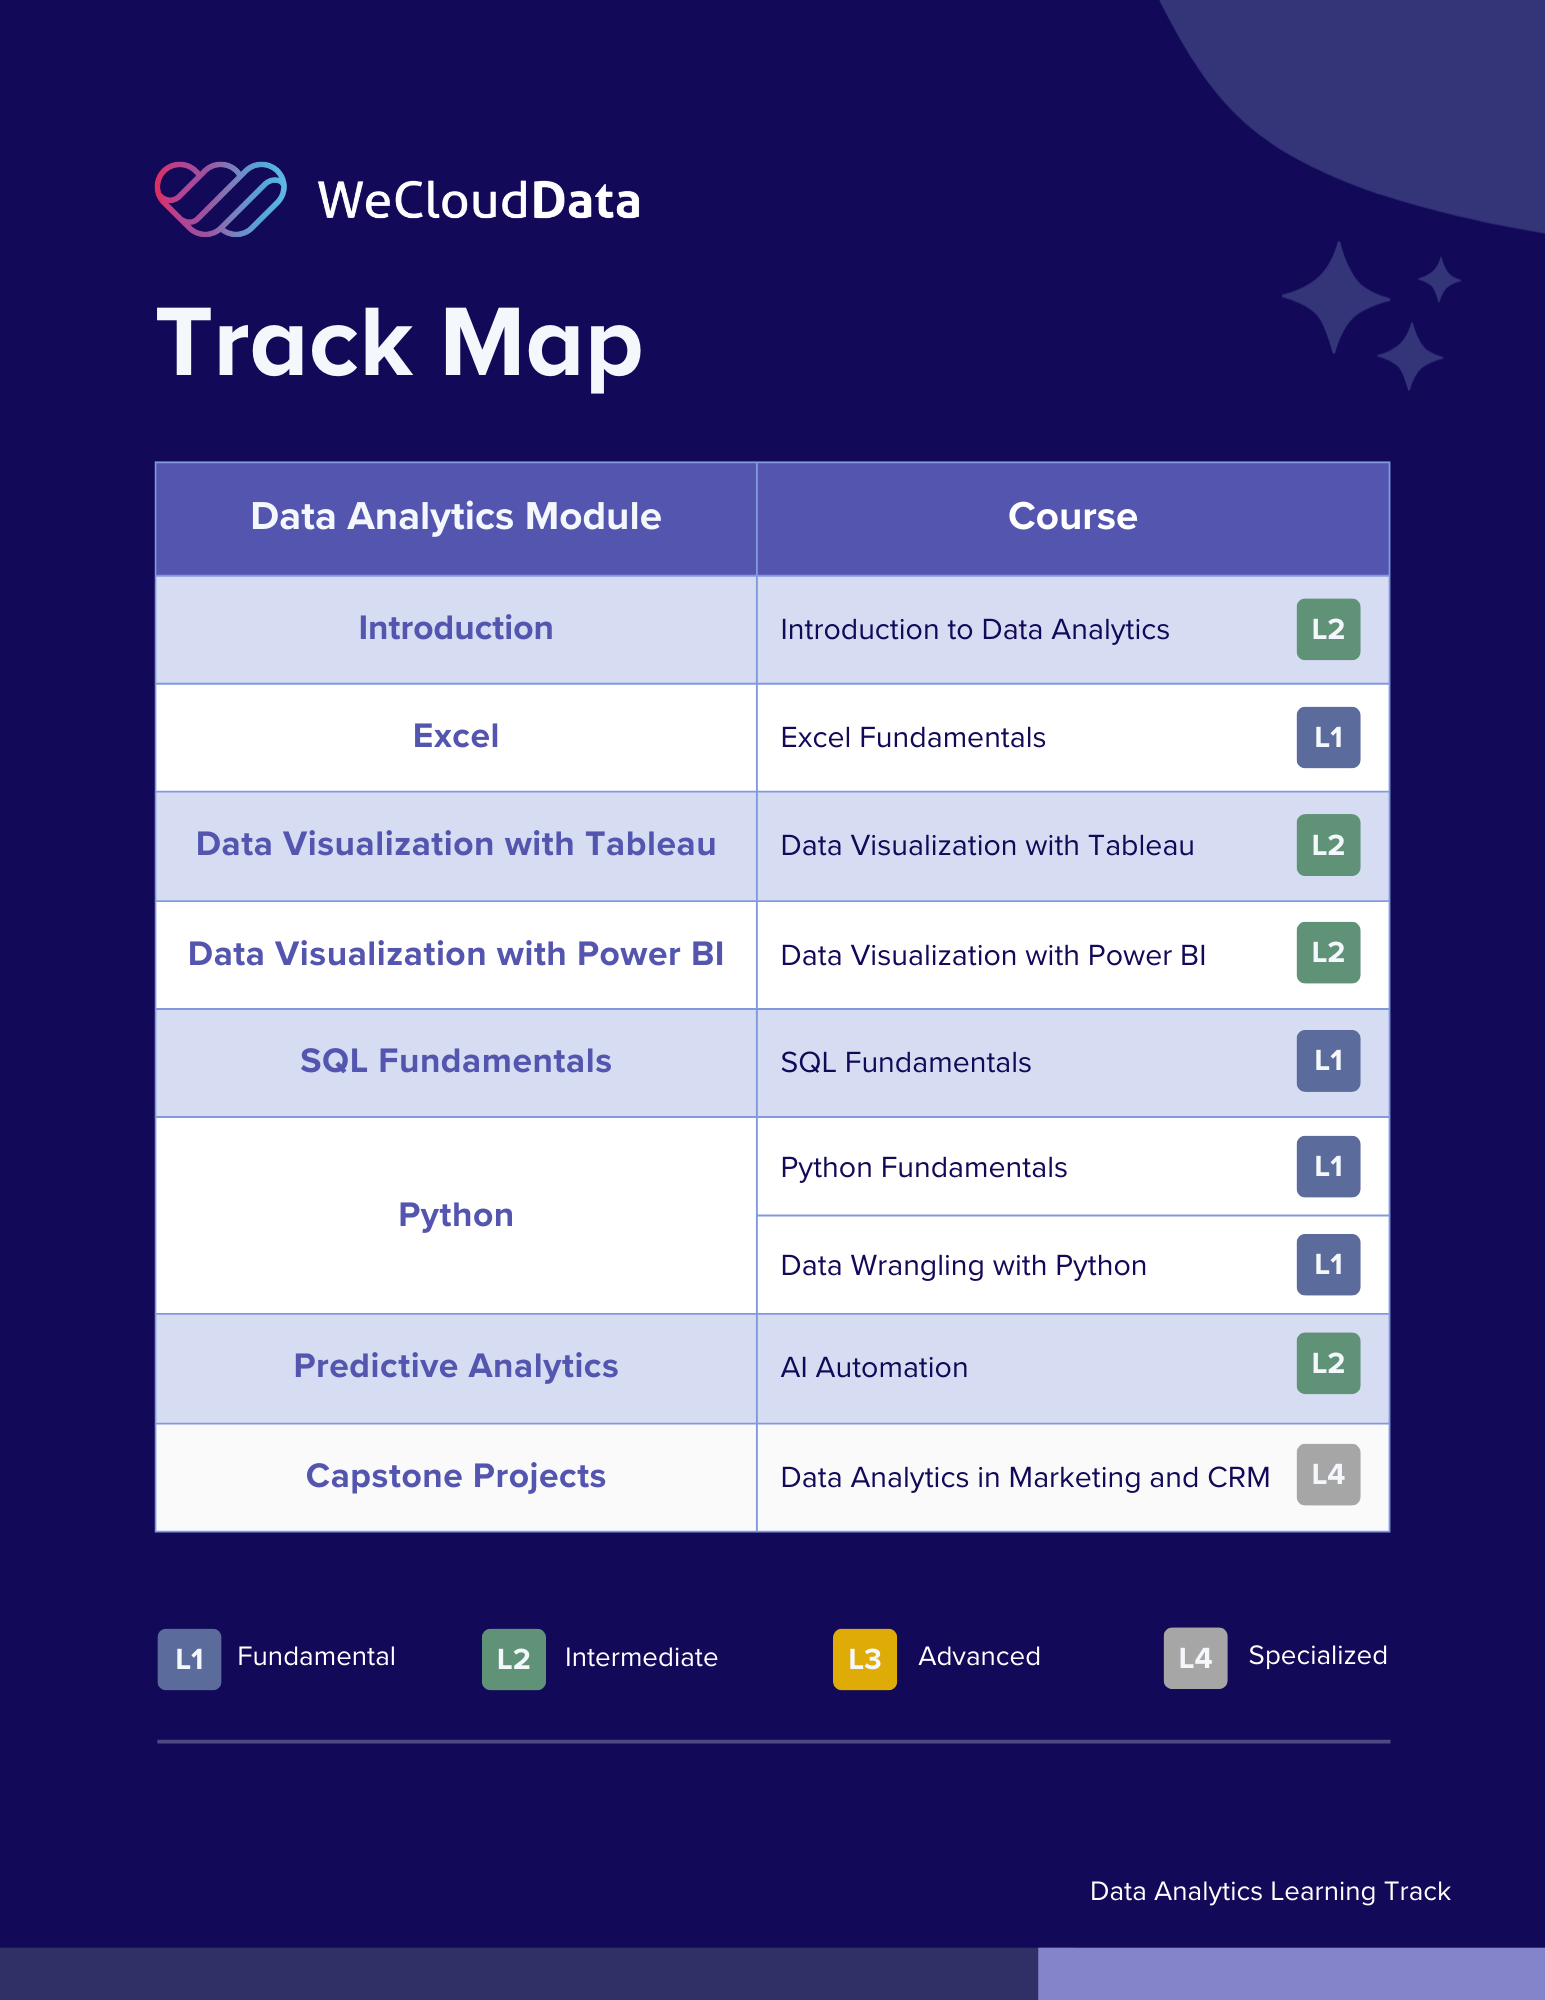
  • Become familiar with widely used tools: Excel, Tableau, Power BI, SQL and Python
  • Understand the steps to install and configure essential analytics tools
Fundamental

By the end of this course, participants will be able to:

  • Navigate Excel and organize, clean, sort, filter, and validate datasets.
  • Apply essential formulas and functions (e.g., SUM, AVERAGE, IF, and VLOOKUP).
  • Use conditional formatting to highlight key insights and trends.
  • Create and customize charts to effectively visualize data.
  • Build interactive dashboards to present dynamic, actionable information.
  • Analyze real-world datasets through hands-on projects to develop practical Excel skills.

Intermediate

By the end of this course, participants will be able to:

  • Navigate Tableau’s interface and connect to various data sources.
  • Create bar charts and other visualizations.
  • Design interactive dashboards using filters, parameters, and calculated fields.
  • Apply best practices in visual storytelling and dashboard layout.
  • Analyze real-world datasets.

Intermediate

By the end of this course, participants will be able to:

  • Understand basic concepts & benefits of data visualization using Power BI.
  • Navigate Power BI effectively and connect to various data sources.
  • Perform ETL operations using Power Query and create data models.
  • Create interactive reports & dashboards tailored to specific business needs.
  • Apply Power BI skills to real-world scenarios in supply chain and retail.
  • Develop a comprehensive project that demonstrates their ability to visualize and analyze data.

Fundamental

By the end of this course, participants will be able to:

  • Grasp the core principles of relational databases and SQL syntax.
  • Effectively design, create, modify, and manage databases and tables.
  • Perform basic and advanced SQL queries for data retrieval and manipulation.
  • Utilize functions, aggregations, and conditional logic to conduct complex data analyses.
  • Apply window functions to uncover data trends and patterns.
  • Implement SQL in real-world applications, such as marketing analytics & risk management.

Fundamental

By the end of this course, participants will be able to:

  • Comprehend Python syntax and foundational programming concepts.
  • Effectively use data structures and perform file operations.
  • Implement control flow statements to create logic-driven programs.
  • Design and use functions to promote code reusability and modular programming.
  • Apply object-oriented programming principles to design and implement classes.
  • Handle exceptions to build robust, error-resistant Python applications.

Fundamental

By the end of this course, participants will be able to:

  • Work with Pandas Series, DataFrames, and Index objects
  • Read, write, filter, and transform structured data using Pandas
  • Clean data to ensure quality and integrity, including handling missing values and outliers
  • Reshape, pivot, and organize data for effective analysis
  • Merge, join, and group datasets using core data manipulation techniques
  • Apply data wrangling skills to real-world problems through hands-on projects

Intermediate

By the end of this course, participants will be able to:

  • Navigate Make’s interface and understand its core features.
  • Design and execute end-to-end automation scenarios from scratch.
  • Connect multiple apps and seamlessly integrate AI modules into workflows.
  • Map, transform, and manipulate data effectively.
  • Apply control logic, variables, and APIs to optimize automation processes.
  • Build, document, and deliver real-world automation projects with AI capabilities.

Specialized

By the end of this course, participants will be able to:

  • Understand the role of CRM data in shaping marketing strategy
  • Use Excel, SQL and Python to derive and communicate marketing insights
  • Analyze campaign performance using real-world customer data
  • Apply key techniques including segmentation, CLV modeling, and A/B testing
  • Deliver actionable recommendations through applied analytics projects
Data Visualization with Python

Coming Soon

Introduction to Generative AI

Coming Soon

Introduction to Data Governance

Coming Soon

Data Analytics in Energy

Coming Soon

This Learning Track include:
Not the right path for you?

We also offer personalized and customized path that suits your learning and career goals. Talk to our advisors.

student success

What our graduates are saying

Davidson Dacleu

Graduated 2022 | Reviewed on 10 February 2023

“Definitely one of the best decision I ever made.”

I arrived in Canada with a Bachelor’s degree in Industrial engineering with no prior experience in analytics and a low English level. At WeCloudData, every instructor, TA, and mentor are all responsible, patient, and helpful, they always would love to share their experience and useful resources. During the boot camp, you have the chance to work on and present projects that you are passionate about, using all the skills that you learned and really making them yours. After the course, I was assigned a mentor (the best in the world) to help with my resume and interviews in June 2022 until I landed a DA position in January 2023.

OUR ALUMNI ARE WORKING AT

Common Questions

Find answers to your questions about the Learning Track

A Learning Track is a curated series of courses, projects, and assessments designed to help you master a specific skill set or career path.

Learning Tracks include multiple courses plus capstone or portfolio projects, offering a more comprehensive and structured learning experience.

Access is tied to your subscription. As long as your subscription is active, you can continue learning. 

Yes, each Learning Track includes hands-on labs and a final capstone project to build your portfolio.

Absolutely. Once you complete the entire Learning Track, you’ll receive a certificate of completion.

Still have questions?

If you have other queries or specific concerns about our Learning Track Subscription, don’t hesitate to let us know. Your feedback is important to us, and we aim to provide the best support possible.

Your Learning Journey Awaits 🚀

Grow your skills, build projects you’ll be proud of, and unlock new opportunities — all at your pace.

Download Data Analytics Track Course Package